

Even small SNP clusters are non-randomly distributed: is this evidence of mutational non-independence?
- PMID: 20071383
- PMCID: PMC2871933
- DOI: 10.1098/rspb.2009.1757
Even small SNP clusters are non-randomly distributed: is this evidence of mutational non-independence?
Abstract
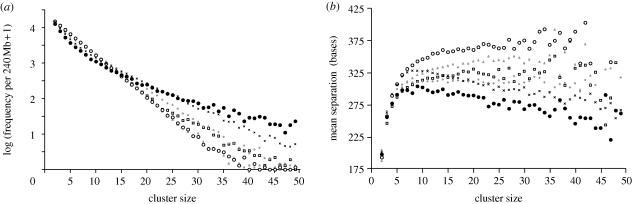
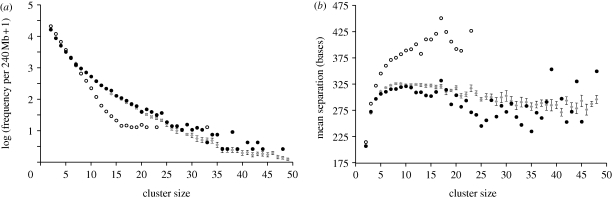
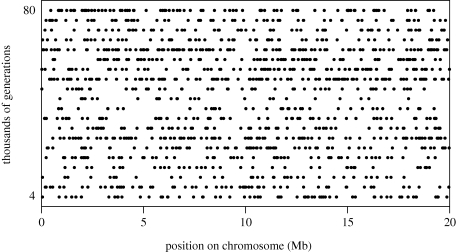
Single nucleotide polymorphisms (SNPs) are distributed highly non-randomly in the human genome through a variety of processes from ascertainment biases (i.e. the preferential development of SNPs around interesting genes) to the action of mutation hotspots and natural selection. However, with more systematic SNP development, one might expect an increasing proportion of SNPs to be distributed more or less randomly. Here, I test this null hypothesis using stochastic simulations and compare this output with that of an alternative hypothesis that mutations are more likely to occur near existing SNPs, a possibility suggested both by molecular studies of meiotic mismatch repair in yeast and by data showing that SNPs cluster around heterozygous deletions. A purely Poisson process generates SNP clusters that differ from equivalent data from human chromosome 1 in both the frequency of different-sized clusters and the SNP density within each cluster, even for small clusters of just four or five SNPs, while clusters on the X chromosome differ from those on the autosomes. In contrast, modest levels of mutational non-independence generate a reasonable fit to the real data for both cluster frequency and density, and also exhibit the evolutionary transience noted for 'mutation hotspots'. Mutational non-independence therefore provides an interesting new hypothesis that appears capable of explaining the distribution of SNPs in the human genome.
Figures
Similar articles
-
A model for the clustered distribution of SNPs in the human genome.Comput Biol Chem. 2016 Oct;64:94-98. doi: 10.1016/j.compbiolchem.2016.06.003. Epub 2016 Jun 8. Comput Biol Chem. 2016. PMID: 27318295
-
Relative effects of mutability and selection on single nucleotide polymorphisms in transcribed regions of the human genome.BMC Genomics. 2008 Jun 17;9:292. doi: 10.1186/1471-2164-9-292. BMC Genomics. 2008. PMID: 18559102 Free PMC article.
-
Human triallelic sites: evidence for a new mutational mechanism?Genetics. 2010 Jan;184(1):233-41. doi: 10.1534/genetics.109.110510. Epub 2009 Nov 2. Genetics. 2010. PMID: 19884308 Free PMC article.
-
Tag SNP selection for association studies.Genet Epidemiol. 2004 Dec;27(4):365-74. doi: 10.1002/gepi.20028. Genet Epidemiol. 2004. PMID: 15372618 Review.
-
An exponential dispersion model for the distribution of human single nucleotide polymorphisms.Mol Biol Evol. 2003 Apr;20(4):579-90. doi: 10.1093/molbev/msg057. Epub 2003 Apr 2. Mol Biol Evol. 2003. PMID: 12679541 Review.
Cited by
-
Correlated and geographically predictable Neanderthal and Denisovan legacies are difficult to reconcile with a simple model based on inter-breeding.R Soc Open Sci. 2021 Jun 16;8(6):201229. doi: 10.1098/rsos.201229. R Soc Open Sci. 2021. PMID: 34150310 Free PMC article.
-
Intact Transition Epitope Mapping-Force Differences between Original and Unusual Residues (ITEM-FOUR).Biomolecules. 2023 Jan 16;13(1):187. doi: 10.3390/biom13010187. Biomolecules. 2023. PMID: 36671572 Free PMC article.
-
An Integrative Phenotype-Genotype Approach Using Phenotypic Characteristics from the UAE National Diabetes Study Identifies HSD17B12 as a Candidate Gene for Obesity and Type 2 Diabetes.Genes (Basel). 2020 Apr 23;11(4):461. doi: 10.3390/genes11040461. Genes (Basel). 2020. PMID: 32340285 Free PMC article.
-
Allelic clustering and ancestry-dependent frequencies of rs6232, rs6234, and rs6235 PCSK1 SNPs in a Northern Ontario population sample.J Community Genet. 2012 Oct;3(4):319-22. doi: 10.1007/s12687-012-0081-5. Epub 2012 Feb 4. J Community Genet. 2012. PMID: 22307923 Free PMC article.
-
Effect of Hybridization on Somatic Mutations and Genomic Rearrangements in Plants.Int J Mol Sci. 2018 Nov 27;19(12):3758. doi: 10.3390/ijms19123758. Int J Mol Sci. 2018. PMID: 30486351 Free PMC article. Review.
References
-
- Akey J. M., Zhang K., Xiong M., Jin L.2003The effect of single nucleotide polymorphism identification strategies on estimates of linkage disequilibrium. Mol. Biol. Evol. 20, 232–242 (doi:10.1093/molbev/msg032) - DOI - PubMed
-
- Amos W.2010Heterozygosity and mutation rate: evidence for an interaction and its implications. BioEssays 32, 82–90 - PubMed
-
- Amos W., Flint J., Xu X.2008Heterozygosity increases microsatellite mutation rate, linking it to demographic history. BMC Genet. 9, 72 (doi:10.1186/1471-2156-9-72) - DOI - PMC - PubMed
-
- Baker S. M., et al. 1995Male mice defective in the DNA mismatch repair gene PMS2 exhibit abnormal chromosome synapsis in meiosis. Cell 82, 309–319 (doi:10.1016/0092-8674(95)90318-6) - DOI - PubMed
MeSH terms
LinkOut - more resources
Full Text Sources
Other Literature Sources
