. 2010 Apr;77(4):575-92.
doi: 10.1124/mol.109.061259. Epub 2010 Jan 13.

Hepatic heme-regulated inhibitor (HRI) eukaryotic initiation factor 2alpha kinase: a protagonist of heme-mediated translational control of CYP2B enzymes and a modulator of basal endoplasmic reticulum stress tone

Affiliations

Hepatic heme-regulated inhibitor (HRI) eukaryotic initiation factor 2alpha kinase: a protagonist of heme-mediated translational control of CYP2B enzymes and a modulator of basal endoplasmic reticulum stress tone

Poulomi Acharya et al. Mol Pharmacol. 2010 Apr.

Abstract

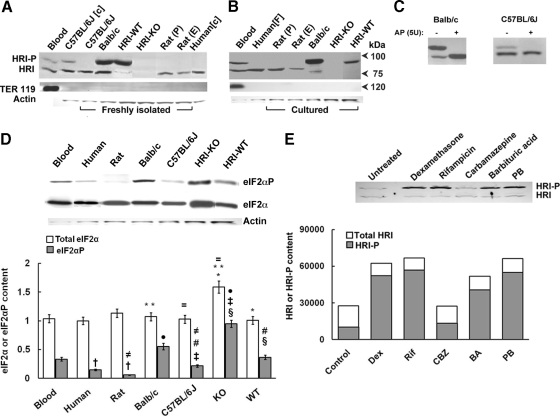
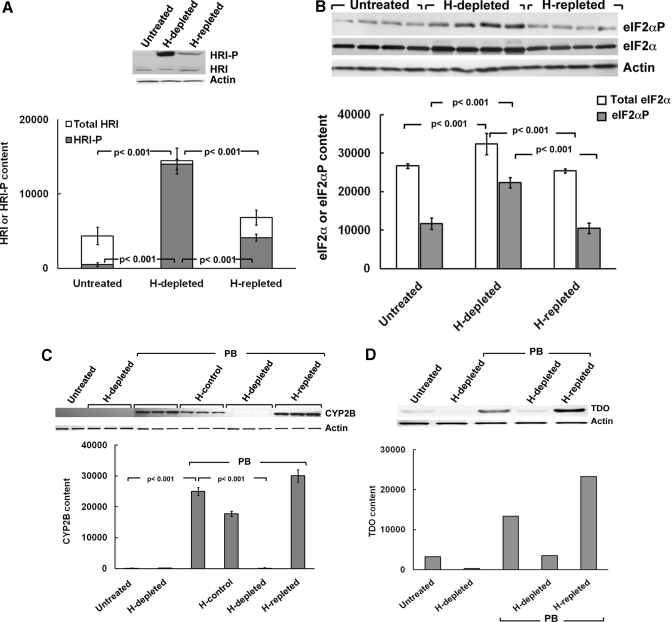
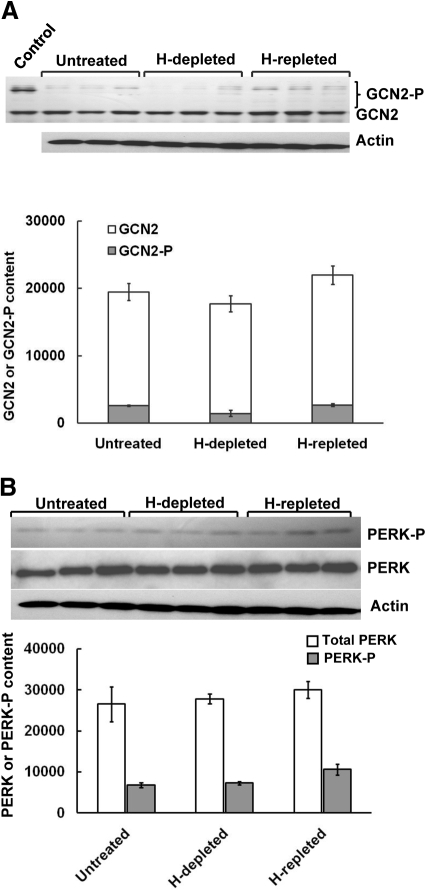
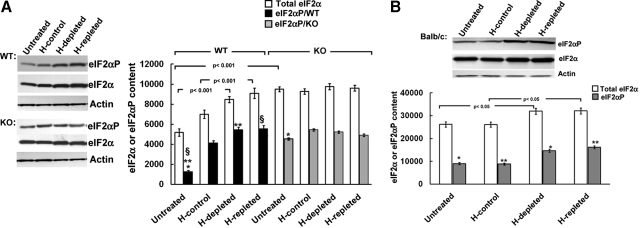
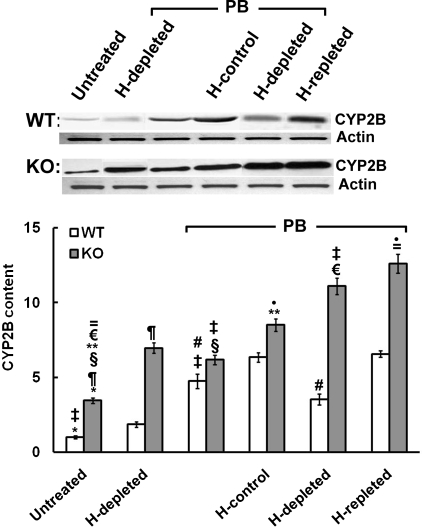
We have reported previously that the hepatic heme-regulated inhibitor (HRI)-eukaryotic initiation factor 2 alpha (eIF2 alpha) kinase is activated in acute heme-deficient states, resulting in translational shut-off of global hepatic protein synthesis, including phenobarbital (PB)-mediated induction of CYP2B enzymes in rats. These findings revealed that heme regulates hepatic CYP2B synthesis at the translational level via HRI. As a proof of concept, we have now employed a genetic HRI-knockout (KO) mouse hepatocyte model. In HRI-KO hepatocytes, PB-mediated CYP2B protein induction is no longer regulated by hepatic heme availability and proceeds undeterred even after acute hepatic heme depletion. It is noteworthy that genetic ablation of HRI led to a small albeit significant elevation of basal hepatic endoplasmic reticulum (ER) stress as revealed by the activation of ER stress-inducible RNA-dependent protein kinase-like ER-integral (PERK) eIF2 alpha-kinase, and induction of hepatic protein ubiquitination and ER chaperones Grp78 and Grp94. Such ER stress was further augmented after PB-mediated hepatic protein induction. These findings suggest that HRI normally modulates the basal hepatic ER stress tone. Furthermore, because HRI exists in both human and rat liver in its heme-sensitive form and is inducible by cytochrome P450 inducers such as PB, these findings are clinically relevant to acute heme-deficient states, such as the acute hepatic porphyrias. Activation of this exquisitely sensitive heme sensor would normally protect cells by safeguarding cellular energy and nutrients during acute heme deficiency. However, similar HRI activation in genetically predisposed persons could lead to global translational arrest of physiologically relevant enzymes and proteins, resulting in the severe and often fatal clinical symptoms of the acute hepatic porphyrias.


Figures

Fig. 1.
Fig. 1.
Immunoblotting analyses of HRI content in freshly isolated and cultured human, rat, and mouse hepatocytes. A, hepatocytes from human, rat and mouse [C57BL/6J, BALB/c, MGB HRI (+/+; WT), or HRI (−/−; KO] were size-fractionated by elutriation (E) or Percoll sedimentation (P) and then lysed either as freshly isolated cells (F) or after culture [c] as detailed under Materials and Methods). Hepatocyte lysates (100 μg of protein) were subjected to Western immunoblotting analyses of HRI and TER-119 content as described under Materials and Methods. Mouse blood lysates (10 μg of protein) containing mature erythroid cells were immunoblotted in parallel as positive controls for both HRI as well as erythroid (TER-119) contamination. A representative example of Western immunoblotting analyses is shown at the top, with corresponding aliquots used for actin immunoblotting analyses as loading controls. B, a representative example of HRI and TER119 Western immunoblotting analyses of lysates (100 μg of protein) from cultured hepatocytes, lysates from mouse blood (20 μg of protein), and freshly isolated human hepatocytes (100 μg of protein as in A) is shown at the top with corresponding aliquots used for actin immunoblotting analyses as loading controls at the very bottom. Native nonphosphorylated HRI and autophosphorylated HRI species are usually detected at ≈76 and 92 kDa, respectively. Note the species differences in actin content of 10 μg of hepatocyte lysate protein. C, lysates (100 μg of protein) from freshly isolated BALB/c or C57BL/6J mouse hepatocytes (106 cells) were incubated in vitro with or without alkaline phosphatase at 37°C for 1 h (Lu et al., 2001), and then subjected to HRI immunoblotting analyses as described previously (Materials and Methods). D, determination of the relative constitutive total hepatic eIF2α and eIF2αP content in lysates (10 μg of protein) of cultured hepatocytes or freshly isolated mouse blood (10 μg of protein) as shown in A and B above. A representative example of Western immunoblotting analyses is shown at the top with corresponding aliquots (10 μg of protein) used for actin immunoblotting analyses as loading controls. Densitometric quantification of total hepatic eIF2α and eIF2αP content and corresponding statistically significant differences between values (mean ± S.D.) from three individual experiments are shown at the bottom. Statistically significant differences in total hepatic eIF2α or eIF2αP content were observed between the two mean ± S.D. values each marked with the same symbol as follows: *, p < 0.001; **, p < 0.001; =, p < 0.001; §, p < 0.001; ‡, p < 0.001; ●, p < 0.001; †, p < 0.05; #, p < 0.05; and ≠, p < 0.05. E, induction of hepatic HRI protein content by Dex (100 μM), PB (500 μM), rifampin (Rif; 15 μM), carbamazepine (CBZ; 500 μM), barbituric acid (BA; 5 mM). Cell cultures were treated with each of the above agents for 2 days, included daily in cell culture media. A prototype immunoblot of hepatocyte lysates (50 μg of protein) is shown on top, with the average protein normalized densitometric quantitation from two separate experiments shown at the bottom.
Fig. 2.
Fig. 2.
Effects of acute hepatic heme depletion and repletion on hepatic HRI autophosphorylation, eIF2α kinase activation, and PB-mediated CYP2B induction in cultured C57BL/6J mouse hepatocytes. Mouse hepatocyte cultures were untreated, heme (H)-depleted, or heme-repleted after heme depletion as detailed under Materials and Methods. A, a representative example of HRI Western immunoblotting analyses of these hepatocyte lysates (100 μg of protein) is shown at the top, with corresponding aliquots used for actin immunoblotting analyses as loading controls. Densitometric quantification of total hepatic HRI and autophosphorylated HRI (HRI-P) content and corresponding statistically significant differences between mean ± S.D. of three individual experiments are shown at the bottom. B, Western immunoblotting analyses of total eIF2α and eIF2αP content in these hepatocyte lysates (10 μg of protein) is shown at the top, with corresponding aliquots used for actin immunoblotting analyses as loading controls. Densitometric quantification of total hepatic eIF2α and eIF2αP content, and corresponding statistically significant differences between mean ± S.D. of 4 individual experiments are shown at the bottom. C, mouse hepatocyte cultures were untreated (first two lanes) or heme-depleted (H; next three lanes), pretreated with PB (next 12 lanes): alone (PB), with heme (H-control), heme depletion (H-depleted), or heme repletion after heme depletion (H-repleted), as detailed under Materials and Methods. CYP2B Western immunoblotting analyses of these hepatocyte lysates (30 μg of protein) is shown at the top, with corresponding aliquots used for actin immunoblotting analyses as loading controls. Densitometric quantification of hepatic CYP2B content from three individual experiments is shown at the bottom. Statistical analyses revealed significant differences in hepatic CYP2B content between untreated and PB-pretreated at p < 0.001, PB/H-depleted, and PB-pretreated at p < 0.001, PB/H-repleted, and PB/H-depleted at p < 0.001. No statistically significant differences were observed between PB-pretreated and PB/H-repleted. D, mouse hepatocyte cultures were treated as in C. TDO Western immunoblotting analyses of these hepatocyte lysates (20 μg of protein) is shown at the top, with corresponding aliquots used for actin immunoblotting analyses as loading controls. Densitometric quantification of hepatic TDO content as the average values from 2 individual experiments is shown at the bottom.
Fig. 3.
Fig. 3.
Effects of acute hepatic heme depletion and repletion on hepatic content of GCN2 and PERK, and their autophosphorylated species in cultured C57BL/6J mouse hepatocyes. A, mouse hepatocyte cultures were untreated, heme (H)-depleted, or heme-repleted after heme depletion as detailed under Materials and Methods. A, GCN2 and GCN2-P Western immunoblotting analyses of these hepatocyte lysates (50 μg of protein) are shown at the top, with corresponding aliquots used for actin immunoblotting analyses as loading controls. Lysates (250 ng of GCN2 protein) from HeLa cells overexpressing GCN2 were included as a positive control (Control). Densitometric quantification of total hepatic GCN2 and autophosphorylated GCN2 (GCN2-P) content (mean ± S.D.) of three individual experiments is shown at the bottom. No statistically significant differences between any of these treatments in either total GCN2 (GCN2 + GCN2-P) or GCN2-P content were found. B, PERK and PERK-P Western immunoblotting analyses of these hepatocyte lysates (100 μg of protein) are shown at the top, with corresponding aliquots used for actin immunoblotting analyses as loading controls. The densitometric quantification of the relative PERK-P content (solid bars) to the total immunochemically detectable PERK content (open bars) is shown at the bottom. Values represent mean ± S.D. of the same three separate experiments shown in A. No statistically significant differences between any of these treatments in either PERK or PERK-P content were found. In parallel, smaller aliquots (10 μg of protein) of these same SDS-PAGE sample buffer-solubilized cell lysates were subjected to actin immunoblotting analyses.
Fig. 4.
Fig. 4.
Effects of acute hepatic heme depletion and repletion on hepatic eIF2α kinase activity in cultured MGB wild-type [WT; HRI (+/+)] and HRI knockout [KO; HRI (−/−)] mouse hepatocytes. A, WT or KO mouse hepatocyte cultures were untreated, treated with heme (20 μM; H-control), heme-depleted, or heme-repleted after heme depletion, as detailed under Materials and Methods. A representative example of total eIF2α and eIF2αP Western immunoblotting analyses of these hepatocyte lysates (10 μg of protein) is shown on the left, with corresponding aliquots used for actin immunoblotting analyses as loading controls. Densitometric quantification of total hepatic eIF2α and eIF2αP content and corresponding statistically significant differences between mean ± S.D. of three individual experiments are shown on the right. Statistically significant differences were observed between basal eIF2αP content of untreated WT and KO hepatocytes (*) at p < 0.001 and between that of untreated WT and either WT/H-depleted (**) or WT/H-repleted (§) at p < 0.001. B, BALB/c mouse hepatocyte cultures were untreated, treated with heme (20 μM; H-control), heme-depleted, or heme-repleted after heme depletion, as detailed under Materials and Methods. A representative example of total eIF2α and eIF2αP Western immunoblotting analyses of these hepatocyte lysates (10 μg of protein) is shown at the top, with corresponding aliquots used for actin immunoblotting analyses as loading controls. Densitometric quantification of total hepatic eIF2α and eIF2αP content and corresponding statistically significant differences between mean ± S.D. of three individual experiments are shown at the bottom. Statistically significant differences in total eIF2α content were observed as indicated between the two values. Corresponding differences between eIF2αP content of the two mean ± S.D. values each marked with the same symbol were as follows: *, p < 0.05; **, p < 0.05.
Fig. 5.
Fig. 5.
Effects of acute hepatic heme depletion and repletion on hepatic content of GCN2 and PERK and their autophosphorylated species in cultured MGB wild-type [WT; HRI (+/+)] and HRI knockout [KO; HRI (−/−)] mouse hepatocyes. A, untreated rat or mouse (C57BL/6J, BALB/c, MGB WT, or KO) hepatocytes were cultured as detailed under Materials and Methods. A, a representative example of GCN2 and GCN2-P Western immunoblotting analyses of these hepatocyte lysates (50 μg of protein) are shown at the top, with corresponding smaller aliquots used for actin immunoblotting analyses as loading controls. Densitometric quantification of total hepatic GCN2 (GCN2 + GCN2-P) and autophosphorylated GCN2 (GCN2-P) content (mean ± S.D.) of three individual experiments is shown at the bottom. Statistically significant differences in hepatic GCN2 content were found between WT and KO lysates at p < 0.001, between WT and BALB/c at p < 0.001, or KO and BALB/c at p < 0.001, KO and rat at p < 0.001, and KO or WT and C57BL/6J at p < 0.001. Statistically significant differences in hepatic GCN2-P content were found between WT and KO lysates at p < 0.05, between WT and BALB/c at p < 0.001, between KO and BALB/c at p < 0.001, between KO and rat at p < 0.001, and between KO or WT and C57BL/6J at p < 0.001. B, WT or KO mouse hepatocyte cultures were untreated, heme (H)-depleted or heme-repleted after heme depletion, as detailed under Materials and Methods. A representative example of total GCN2 and GCN2-P Western immunoblotting analyses of these hepatocyte lysates (50 μg of protein) is shown at the top, with corresponding smaller aliquots used for actin immunoblotting analyses as loading controls. Densitometric quantification of total hepatic GCN2 (GCN2 + GCN2-P) and phosphorylated GCN2 (GCN2-P) content and corresponding statistically significant differences between mean ± S.D. of three individual experiments are shown at the bottom. Statistically significant differences were observed in the total hepatic GCN2 and GCN2-P content of untreated and H-depleted WT hepatocytes between the two mean ± S.D. values each marked with the same symbol as follows: §, p < 0.001; *, p < 0.001, respectively. Total hepatic GCN2 content of H-depleted WT cells was significantly different from that of H-repleted WT cells (#) at p < 0.001. Total hepatic GCN2 content of WT hepatocytes was significantly different from that of KO hepatocytes (**) at p < 0.05. No significant differences were found between any other values. C, WT or KO mouse hepatocyte cultures were untreated, treated with heme (20 μM; H-control), heme (H)-depleted, or heme-repleted after heme depletion, as detailed under Materials and Methods. PERK and PERK-P Western immunoblotting analyses of these hepatocyte lysates (100 μg of protein) are shown at the left, with corresponding smaller aliquots (10 μg of protein) of these same SDS-PAGE sample buffer-solubilized cell lysates used for actin immunoblotting analyses as loading controls. The densitometric quantification of the relative PERK-P content (solid bars) to the total PERK immunochemically detectable content (open bars) is shown at the right. Values represent mean ± S.D. of three separate experiments. Statistically significant differences in either PERK or PERK-P content between the two mean ± S.D. values each marked with the same symbol were as follows: *, p < 0.001; §, p < 0.001; ‡, p < 0.001; ¶, p < 0.001; and **, p < 0.001.
Fig. 6.
Fig. 6.
Total hepatic protein ubiquitination and effects of acute hepatic heme depletion and repletion on hepatic content of ER-chaperones Grp78 and Grp94 in cultured MGB wild-type [WT; HRI (+/+)] and HRI knockout [KO; HRI (−/−)] mouse hepatocytes. A, untreated WT or KO mouse hepatocytes pooled from two mice each were cultured as detailed under Materials and Methods for each individual experiment. Hepatocyte lysates (50 μg of protein) from four individual experiments were prepared, and total hepatic protein ubiquitination was examined by Western immunoblotting analyses as described under Materials and Methods. B, WT or KO mouse hepatocyte cultures were untreated, treated with heme (20 μM; H-control), heme (H)-depleted, or heme-repleted after heme depletion, as in Fig. 5C. Aliquots (25 μg of protein) of these same SDS-PAGE sample buffer-solubilized cell lysates were used for Grp78 immunoblotting analyses and other aliquots (10 μg of protein) of these same SDS-PAGE sample buffer-solubilized cell lysates used for actin immunoblotting analyses as loading controls (Top). The densitometric quantification of the relative immunochemically detectable Grp78 content in KO (solid bars) to the WT (open bars) is shown below. Values represent mean ± S.D. of three separate experiments. Statistically significant differences in Grp78 content between the two mean ± S.D. values each marked with the same symbol were as follows: *, p < 0.05; §, p < 0.001; and ‡, p < 0.001. C, aliquots (25 μg of protein) of these same SDS-PAGE sample buffer-solubilized cell lysates were used for Grp94 immunoblotting analyses and other aliquots (10 μg of protein) used for actin immunoblotting analyses as loading controls (top). The densitometric quantification of the relative immunochemically detectable Grp94 content in KO (solid bars) to the WT (open bars) is shown below. Values represent mean ± S.D. of three separate experiments. Statistically significant differences in Grp94 content between the values were as indicated. The difference in basal Grp94 content of untreated WT and KO hepatocytes (*) was statistically significant at p < 0.001.
Fig. 7.
Fig. 7.
Effects of acute hepatic heme depletion and repletion on PB-mediated CYP2B induction in cultured MGB wild-type [WT; HRI (+/+)] and HRI knockout [KO; HRI (−/−)] mouse hepatocytes. WT or KO mouse hepatocyte cultures were untreated or heme (H)-depleted (first two lanes), or pretreated with PB (next four lanes): alone (lane 3), with heme (H-control; lane 4), heme depletion (H-depleted; lane 5), or heme repletion after heme depletion (H-repleted; lane 6), as detailed under Materials and Methods. A representative example of CYP2B Western immunoblotting analyses of these hepatocyte lysates (30 μg of protein) is shown at the top, with corresponding aliquots used for actin immunoblotting analyses as loading controls. Densitometric quantification of hepatic CYP2B content from three individual experiments is shown at the bottom. Statistical analyses revealed significant differences in hepatic CYP2B content between the two mean ± S.D. values each marked with the same symbol as follows: *, p < 0.001; §, p < 0.001; ‡, p < 0.001; ¶, p < 0.001; €, p < 0.001; #, p < 0.001; =, p < 0.001; and **, p < 0.001. No statistically significant differences were observed between PB-pretreated/H-control and PB/H-repleted WT lysates.
Fig. 8.
Fig. 8.
Effects of acute hepatic heme depletion and repletion on hepatic HRI content and autophosphorylation, and eIF2α kinase activity in cultured MGB wild-type [WT; HRI (+/+)] mouse hepatocytes with and without PB pretreatment. A, WT mouse hepatocyte cultures were untreated, treated with heme (H-control), heme-depleted (H-depleted), or heme-repleted after heme depletion (H-repleted) (first four lanes), or pretreated with PB (next three lanes) alone (lane 5), heme-depleted (H-depleted; lane 6), or heme-repleted after heme depletion (H-repleted ; lane 7), as detailed under Materials and Methods. A representative example of HRI and HRI-P Western immunoblotting analyses of these hepatocyte lysates (100 μg of protein) is shown at the top, with corresponding smaller aliquots (10 μg of protein) of these same SDS-PAGE sample buffer-solubilized cell lysates used for actin immunoblotting analyses as loading controls. Densitometric quantification of total hepatic HRI and HRI-P content from three individual experiments is shown at the bottom. Statistical analyses revealed significant differences in both hepatic HRI and HRI-P content between untreated and PB-pretreated at p < 0.001, and between PB/H-repleted and PB/H-depleted at p < 0.05. No statistically significant differences were observed between PB/H-depleted and PB-pretreated or between PB-pretreated and PB/H-repleted WT lysates. B, WT or KO mouse hepatocyte cultures were untreated or pretreated with PB alone (lane 2) and then either heme-depleted (lane 3) or heme-repleted after heme depletion (lane 4), as detailed under Materials and Methods. A representative example of total eIF2α and eIF2αP Western immunoblotting analyses of these hepatocyte lysates (10 μg of protein) is shown at the top with corresponding aliquots used for actin immunoblotting analyses as loading controls. Densitometric quantification of total hepatic eIF2α and eIF2αP content, and corresponding statistically significant differences between mean ± S.D. of 3 individual experiments are shown at the bottom. Statistically significant differences in eIF2α or eIF2αP content were observed between the two mean ± S.D. values each marked with the same symbol as follows: *, p < 0.001; §, p < 0.001; ‡, p < 0.001; =, p < 0.001; ●, p < 0.001; and **, p < 0.001.
Fig. 9.
Fig. 9.
Effects of acute hepatic heme depletion and repletion on the hepatic content of GCN2 and PERK and their autophosphorylated species, Grp78 and Grp94 content in cultured MGB wild-type [WT; HRI (+/+)] and HRI knockout [KO; HRI (−/−)] mouse hepatocytes with and without PB-pretreatment. A, WT or KO mouse hepatocyte cultures were untreated or pretreated with PB alone (lane 2) and then either heme (H)-depleted (lane 3), or heme-repleted after heme depletion (lane 4), as detailed under Materials and Methods. A representative example of total GCN2 and GCN2-P Western immunoblotting analyses of these hepatocyte lysates (50 μg of protein) is shown with corresponding smaller aliquots (10 μg of protein) of these same SDS-PAGE sample buffer-solubilized cell lysates used for actin immunoblotting analyses as loading controls at the top. Corresponding densitometric quantification of total hepatic GCN2 and GCN2-P content (mean ± S.D.) of three individual experiments is shown at the bottom. Statistically significant differences were observed in total hepatic GCN2 and GCN2-P content of untreated WT and KO hepatocytes between the two mean ± S.D. values each marked with the same symbol as follows: *, p < 0.001; §, p < 0.001; ‡, p < 0.001; ¶, p < 0.001; €, p < 0.001; =, p < 0.001; ●, p < 0.001; ≠, p < 0.001; and **, p < 0.001. B, aliquots of the same SDS-PAGE sample buffer-solubilized cell lysates (100 μg of protein) used in A were subjected to total PERK and PERK-P Western immunoblotting analyses with corresponding smaller aliquots (10 μg of protein) used for actin immunoblotting analyses as loading controls. A representative example of these immunoblots is shown at the top. Corresponding densitometric quantification of total hepatic PERK and PERK-P content (mean ± S.D.) of three individual experiments is shown at the bottom. Statistically significant differences were observed between total hepatic PERK or PERK-P content of untreated WT and KO hepatocytes between the two mean ± S.D. values each marked with the same symbol as follows: *, p < 0.001; §, p < 0.001; ‡, p < 0.001; †, p < 0.001; and **, p < 0.001. C, aliquots of these SDS-PAGE sample buffer-solubilized cell lysates (25 μg of protein) used in A were subjected to Grp78 Western immunoblotting analyses with corresponding aliquots (10 μg of protein) used for actin immunoblotting analyses as loading controls. A representative example of these immunoblots is shown at the top. Corresponding densitometric quantification of total hepatic Grp78 content (mean ± S.D.) of three individual experiments is shown at the bottom. Statistically significant differences were observed between Grp78 content of untreated WT and KO hepatocytes between the two mean ± S.D. values each marked with the same symbol as follows: *, p < 0.001; §, p < 0.001; ‡, p < 0.001; =, p < 0.001; and **, p < 0.001. D, aliquots of these SDS-PAGE sample buffer-solubilized cell lysates (25 μg of protein) used in A were subjected to Grp94 Western immunoblotting analyses with corresponding aliquots (10 μg of protein) used for actin immunoblotting analyses as loading controls. A representative example of these immunoblots is shown at the top. Corresponding densitometric quantification of total hepatic Grp94 content (mean ± S.D.) of three individual experiments is shown at the bottom. Statistically significant differences were observed between the two mean ± S.D. values each marked with the same symbol as follows: **, p < 0.001; §, p < 0.05; ‡, p < 0.001; =, p < 0.001; and #, p < 0.001. No statistically significant differences were observed with PB/H-depleted and PB/H-repleted for either WT or KO cells.
Fig. 10.
Fig. 10.
Effects of heme depletion or repletion on PB-mediated induction of hepatic CYP2B and CYP3A in C57BL/6J HRI (−/−; KO) hepatocytes and corresponding HRI (+/+; WT) controls. A, treatments were carried out exactly as detailed under Materials and Methods. Values are mean ± S.D. of three separate experiments. Statistically significant differences between two individual values are as shown by the * (p < 0.001). B, qRT-PCR analyses of total RNA from cultured hepatocytes treated as in A are shown at the top. Values are mean ± S.D. of three separate experiments. Statistically significant differences between the two individual values are as shown by the * (p < 0.001). A magnified graph of the CYP2B mRNA values in untreated hepatocytes (non–PB-treated) included at the top are shown at the bottom. C, pulse-chase and CYP2B immunoprecipitation analyses of untreated and PB-pretreated hepatocytes are shown at the bottom. The relative [35S]Met/Cys incorporated into equivalent aliquots of CYP2B immunoprecipitates monitored by scintillation counting is shown on the left. Statistically significant differences were observed between the two mean ± S.D. values each marked with the same symbol at p < 0.001. The corresponding Typhoon 9400 analyses of corresponding CYP2B immunoprecipitate aliquots subjected to SDS-PAGE are shown on the right.
Fig. 11.
Fig. 11.
qRT-PCR analyses of HRI mRNA after heme depletion or repletion of untreated or PB-treated C57BL/6J HRI (−/−; KO) hepatocytes and corresponding HRI (+/+; WT) controls. For experimental details, see Materials and Methods. Statistically significant differences were observed between the two mean ± S.D. values from 3 separate experiments each marked with the same symbol as follows: #, p < 0.001; §, p < 0.001; or as shown.
Fig. 12.
Fig. 12.
The relative hepatic content of eIF2α and eIF2αP and qRT-PCR analyses of Grp78 and Grp 94 mRNA content in untreated and PB-treated C57BL/6J WT and HRI(−/−) hepatocytes. A, lysates from H-depleted or H-repleted hepatocytes were assayed exactly as detailed under Materials and Methods. A prototype immunoblot is shown. Values from C57BL/6J WT are mean ± S.D. of three separate experiments or average of two separate experiments in the case of the C57BL/6J HRI (−/−). The interindividual variability between the two average values of two separate experiments each marked by the same symbol was >10%. B, hepatocytes were treated exactly as detailed under Materials and Methods. Lysates from H-depleted or H-repleted hepatocytes were assayed exactly as detailed in Fig. 8B. A prototype immunoblot is shown. The interindividual variability between the two average values of two separate experiments each marked by the same symbol was >10%. C, qRT-PCR analyses of Grp78 mRNA after heme depletion or repletion of untreated or PB-treated C57BL/6J HRI (−/−; KO) hepatocytes and corresponding HRI (+/+; WT) controls. Corresponding analyses of Grp78 mRNA from hepatocytes treated in parallel with thapsigargin (Tg), an established ER-stress inducer, are also included. Note the Y-axes scale differences. For experimental details, see Materials and Methods. Statistically significant differences were observed between the two mean ± S.D. values from three separate experiments each marked with the same symbol as follows: #, p < 0.05; §, p < 0.001; ‡, p < 0.05; ¶, p < 0.001; €, p < 0.05; =, p < 0.001; ●, p < 0.001; †, p < 0.001; *, p < 0.05; and **, p < 0.001. D, corresponding qRT-PCR analyses of Grp94 mRNA. Statistically significant differences between the two mean ± S.D. values from three separate experiments each marked with the same symbol were as follows: #, p < 0.05; §, p < 0.05; ‡, p < 0.001; ¶, p < 0.001; =, p < 0.05; ●, p < 0.05; †, p < 0.05; and *, p < 0.05.
Fig. 13.
Fig. 13.
Heme-mediated translational control of PB-mediated CYP2B induction via hepatic HRI. A, heme-repleted, C57BL/6J mouse HRI-WT hepatocytes. PB-mediated activation of cytoplasmic constitutive androstane receptor (CAR) results in its translocation into the nucleus, where it heterodimerizes with another nuclear receptor, retinoid X receptor (RXR). The CAR-RXR heterodimeric complex then interacts with the PB-responsive enhancer module (PBREM) in the 5′-promoter region of CYP2B genes, thereby inducing their expression through enhanced transcriptional-translational activation as detailed (Kim et al., 2001; Williams et al., 2004; Timsit and Negishi, 2007). PB induction of CYP2B protein requires coordinated induction of heme synthesis. Under conditions of normal hepatic heme availability, hepatic HRI is inhibited and functionally inactive, and CYP2B protein translation proceeds normally. After all available hepatic heme is consumed, the ensuing transient heme depletion would activate HRI, in turn shutting off CYP2B protein translation. B, heme-deficient, C57BL/6J mouse HRI-WT hepatocytes. Similar PB-mediated CAR-RXR transcriptional activation of CYP2B genes via PBREM occurs in the heme-deficient liver. In concurrence with previous reports (Srivastava et al., 1989; Sinclair et al., 1990; Jover et al., 2000), heme deficiency does not affect the transcriptional activation of CYP2B genes (Fig. 10B; Han et al., 2005b). However, heme deficiency relieves hepatic HRI from inhibition, resulting in its autoactivation (via autophosphorylation), thereby unleashing its eIF2α kinase activity with consequent arrest of global hepatic protein translation, including that of CYP2B enzymes. C, heme-deficient, HRI KO (−/−) mouse hepatocytes. Genetic deletion of HRI results in the loss of this translational control in response to heme deficiency. Consequently, after PB induction, uncontrolled de novo synthesis of hepatic proteins, including CYP2B, proceeds undeterred despite insufficient heme for holoP450 assembly. Inordinate accumulation of hepatic protein triggers enhanced ubiquitination and an ER stress response as discussed.

References

    1. Acharya P, Engel JC, Correia MA. (2009) Hepatic CYP3A suppression by high concentrations of proteasomal inhibitors: a consequence of RNA-dependent protein kinase-like ER-bound eukaryotic initiation factor 2alpha (eIF2alpha)-kinase (PERK) and general control nonderepressible-2 eIF2α kinase (GCN2), and global translational shutoff. Mol Pharmacol 76:503–515 - PMC - PubMed
    1. Anderson KE, Bloomer JR, Bonkovsky HL, Kushner JP, Pierach CA, Pimstone NR, Desnick RJ. (2005) Recommendations for the diagnosis and treatment of the acute porphyrias. Ann Intern Med 142:439–450 - PubMed
    1. Berlanga JJ, Herrero S, de Haro C. (1998) Characterization of the hemin-sensitive eukaryotic initiation factor 2alpha kinase from mouse nonerythroid cells. J Biol Chem 273:32340–32346 - PubMed
    1. Chefalo PJ, Oh J, Rafie-Kolpin M, Kan B, Chen JJ. (1998) Heme-regulated eIF-2alpha kinase purifies as a hemoprotein. Eur J Biochem 258:820–830 - PubMed
    1. Chen JJ, Crosby JS, London IM. (1994) Regulation of heme-regulated eIF-2 alpha kinase and its expression in erythroid cells. Biochimie 76:761–769 - PubMed

Publication types

MeSH terms