. 2010 Apr;298(4):F923-34.
doi: 10.1152/ajprenal.00567.2009. Epub 2010 Jan 13.

Impact of Cyclin B2 and Cell division cycle 2 on tubular hyperplasia in progressive chronic renal failure rats

Affiliations

Impact of Cyclin B2 and Cell division cycle 2 on tubular hyperplasia in progressive chronic renal failure rats

Kumiko Nishihara et al. Am J Physiol Renal Physiol. 2010 Apr.

Abstract

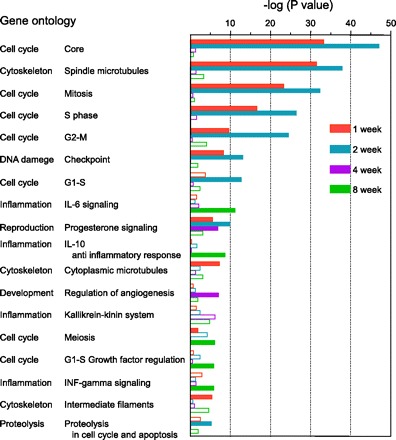
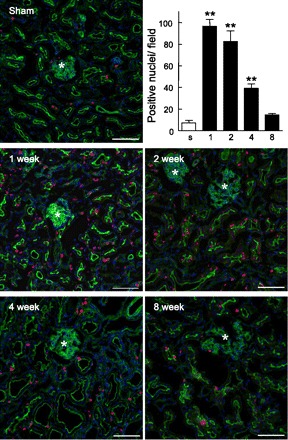
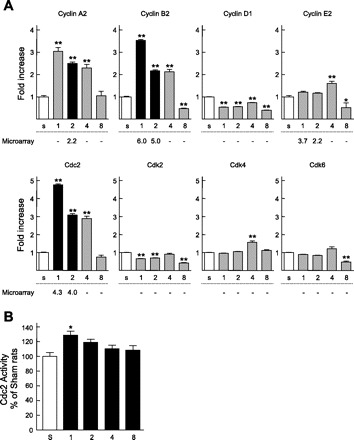
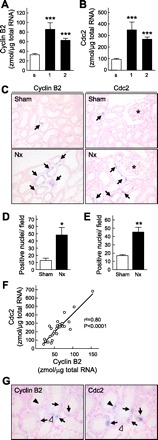
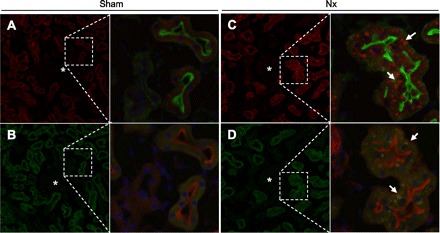
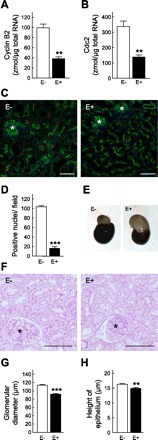
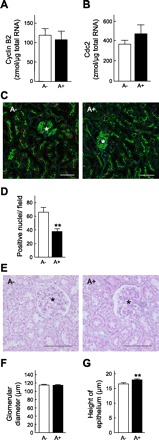
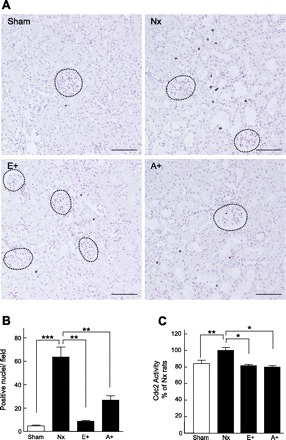
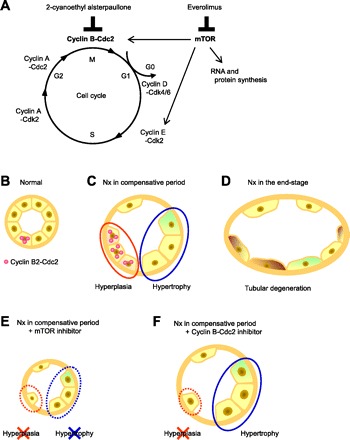
To clarify the specific molecular events of progressive tubular damage in chronic renal failure (CRF), we conducted microarray analyses using isolated proximal tubules from subtotally nephrectomized (Nx) rats as a model of CRF. Our results clearly demonstrated time-dependent changes in gene expression profiles localized to proximal tubules. The expression of mitosis-specific genes Cyclin B2 and Cell division cycle 2 (Cdc2) was significantly and selectively increased in the proximal tubules during the compensated period but decreased to basal level in the end-stage period. Administration of everolimus, a potent inhibitor of mammalian target of rapamycin, markedly reduced compensatory hypertrophy and hyperplasia of epithelial cells, which was accompanied by complete abolishment of the expression of Cyclin B2 and Cdc2 enhancement; renal function was then severely decreased. Treatment with the Cdc2 inhibitor 2-cyanoethyl alsterpaullone clearly decreased epithelial cell hyperplasia, based on staining of phosphorylated histone H3 and Ki-67, while hypertrophy was not inhibited. In conclusion, we have demonstrated roles of Cyclin B2 and Cdc2 in the epithelial hyperplasia in response to Nx. These results advance the knowledge of the contribution of cell cycle regulators, especially M phase, in pathophysiology of tubular restoration and/or degeneration, and these two molecules are suggested to be a marker for the proliferation of proximal tubular cells in CRF.


Figures

Fig. 1.
Fig. 1.
Biological function of the genes significantly changed in the microarray analysis. To assess the results of the microarray analysis in terms of biological function, the genes that significantly changed each week after subtotal nephrectomy (Nx) were classified according to their Gene Ontology and P values were calculated with MetaCore software. A filled column implies that the false discovery rate was <0.01.
Fig. 2.
Fig. 2.
Expression of Ki-67 in the kidney. Immunofluorescent labeling of Ki-67 in sham-operated and Nx rats at 1, 2, 4, and 8 wk after surgery is shown. Red signals for Ki-67 merged with green signals for phalloidin and with blue signals for 4′,6-diamidino-2-phenylindole (DAPI). *, Glomeruli. Scale bars 100 μm. Stained nuclei in the proximal tubules were counted in 3 independent regions at 100-fold magnification. s, Sham-operated rats; 1, 2, 4, and 8, Nx rats at 1, 2, 4, and 8 wk after surgery. Multiple comparisons were performed with Dunnett's 2-tailed test after a 1-way ANOVA. **P < 0.01, significantly different from sham-operated rats.
Fig. 3.
Fig. 3.
Expression levels of cell cycle-related genes and the activities of Cell division cycle 2 (Cdc2) in the remnant kidney. A: mRNA levels of Cyclin A2, Cyclin B2, Cyclin D1, Cyclin E2, Cdc2, Cyclin-dependent kinase (Cdk)2, Cdk4, and Cdk6. An equal amount of cDNA was pooled from the remnant kidney of each rat, and the expressional changes of mRNA were measured by real-time PCR and analyzed by the ΔΔCt method (where Ct is threshold cycle). Numbers below each column show the fold change in the microarray analysis; − indicates that expressional change was not significant in the microarray analysis. Open columns represent levels in sham-operated rats; black and gray columns represent results of the microarray analysis validated by real-time PCR analysis or not, respectively. B: kinase activities of Cdc2. Multiple comparisons were performed with Dunnett's 2-tailed test after a 1-way ANOVA. *P < 0.05, **P < 0.01, significantly different from sham-operated rats.
Fig. 4.
Fig. 4.
Detection of Cyclin B2 and Cdc2 in the kidney by real-time PCR and in situ hybridization analysis. A and B: mRNA levels of Cyclin B2 (A) and Cdc2 (B) were measured by real-time PCR. s, Sham-operated rats; 1 and 2, Nx rats at 1 and 2 wk after surgery. Multiple comparisons were performed with Dunnett's 2-tailed test after a 1-way ANOVA. ***P < 0.001, significantly different from sham-operated rats. C: in situ hybridization of Cyclin B2 (left) and Cdc2 (right). *, Glomeruli. Magnification ×200. D and E: Cyclin B2 (D)- and Cdc2 (E)-positive nuclei in the renal cortex were counted. *P < 0.05, **P < 0.01, significantly different from sham-operated rats. F: correlation between mRNA levels of Cyclin B2 and Cdc2. Linear regression analysis was performed, and the correlation coefficient (r) was calculated. G: in situ hybridization analysis of Cyclin B2 and Cdc2 with serial sections in Nx rats was carried out. Arrows, positive staining for both Cyclin B2 and Cdc2; open arrowhead, positive staining for Cyclin B2 without Cdc2; filled arrowhead, positive staining for Cdc2 without Cyclin B2.
Fig. 5.
Fig. 5.
Immunofluorescent analysis of Cyclin B2 and Cdc2 in the kidney. The kidney was perfused, fixed, and then embedded. Sections (5 μm) were stained with a specific antibody for Cyclin B2 (A and C, red) or Cdc2 (B and D, green), phalloidin (A and C, green; B and D, red), and DAPI (blue). A and B: series of sections from sham-operated rat kidney. C and D: series of sections from Nx rat kidney at 2 wk after surgery. Arrows, aggregation of signals for Cyclin B2 or Cdc2; *, glomeruli. Magnification ×200 and ×400.
Fig. 6.
Fig. 6.
Effects of administration of everolimus in Nx rats. Nx rats were subcutaneously treated with vehicle (E−) or everolimus (E+, 2 mg/kg) for 14 days immediately after Nx. A and B: detection of mRNA of cyclin B2 (A) and Cdc2 (B) by real-time PCR. C: immunofluorescent analysis of Ki-67. D: numbers of stained nuclei for Ki-67 in the proximal tubules were counted in 3 independent regions at 100-fold magnification. E: appearance of remnant kidney. F: representative photographs of periodic acid Schiff (PAS) staining of the remnant kidney. G and H: measurement of glomerular diameter (G) and the height of epithelial cells (H). *, Glomeruli. Scale bars 100 μm. **P < 0.01, ***P < 0.001, significantly different from vehicle-treated (E−) rats.
Fig. 7.
Fig. 7.
Effects of administration of 2-cyanoethyl alsterpaullone (CE-ALP) in Nx rats. Nx rats were subcutaneously treated with vehicle (A−) or CE-ALP (A+, 0.5 mg/kg) for 14 days immediately after Nx. A and B: measurement of mRNA levels of Cyclin B2 (A) and Cdc2 (B) by real-time PCR. C: immunofluorescent analysis of Ki-67. D: numbers of stained nuclei in the proximal tubules were counted in 6 independent regions at 100-fold magnification. E: representative photographs of PAS staining of the remnant kidney. F and G: measurement of glomerular diameter (F) and height of epithelial cells (G). *, Glomeruli. Scale bars 100 μm. **P < 0.01, significantly different from vehicle-treated (A−) rats.
Fig. 8.
Fig. 8.
Effects of everolimus and CE-ALP on expression of phospho (p)-histone H3 and activities of Cdc2 in the kidney. A: representative photograph of kidney stained with p-histone H3 in sham-operated rats, Nx rats, and Nx rats treated with everolimus (E+) or CE-ALP (A+) at 2 wk after surgery. Dotted circles, glomeruli. Scale bars 100 μm. B: numbers of nuclei stained for p-histone H3 in the proximal tubules were counted at 100-fold magnification. C: activities of Cdc2 after administration of everolimus and CE-ALP. Multiple comparisons were performed with Bonferroni's test after a 1-way ANOVA. *P < 0.05, **P < 0.01, ***P < 0.001, significantly different.
Fig. 9.
Fig. 9.
The hypothesized scheme of molecular responses in tubular epithelial hyperplasia and hypertrophy in chronic renal failure (CRF). A: molecular targets of mammalian target of rapamycin (mTOR) inhibitor and Cdc2 inhibitor in the cell cycle and mTOR pathway. B–F: renal proximal tubules of normal rats (B) and Nx rats (C–F). A portion of the renal epithelial cells in the proximal tubules was positive for Cyclin B2-Cdc2 (B). Hyperplasia via induction of Cyclin B2-Cdc2, G2-M cyclins, and hypertrophy simultaneously occurred in the compensative period in CRF rats (C). In end-stage CRF, tubular atrophy and degeneration were observed (D). E: proximal tubules treated with the mTOR inhibitor. Neither hyperplasia nor hypertrophy of tubular epithelial cells occurred, resulting in severe renal damage. F: proximal tubules treated with the Cyclin B-Cdc2 inhibitor. Only hyperplasia was inhibited, and a moderate reduction in renal function was observed.

Similar articles

Cited by

References

    1. Bonventre JV. Dedifferentiation and proliferation of surviving epithelial cells in acute renal failure. J Am Soc Nephrol 14, Suppl 1: S55–S61, 2003. - PubMed
    1. Bottinger EP, Bitzer M. TGF-beta signaling in renal disease. J Am Soc Nephrol 13: 2600–2610, 2002. - PubMed
    1. Chen JK, Chen J, Neilson EG, Harris RC. Role of mammalian target of rapamycin signaling in compensatory renal hypertrophy. J Am Soc Nephrol 16: 1384–1391, 2005. - PubMed
    1. Chen JK, Chen J, Thomas G, Kozma SC, Harris RC. S6 kinase 1 knockout inhibits uninephrectomy- or diabetes-induced renal hypertrophy. Am J Physiol Renal Physiol 297: F585–F593, 2009. - PMC - PubMed
    1. Frazier KS, Paredes A, Dube P, Styer E. Connective tissue growth factor expression in the rat remnant kidney model and association with tubular epithelial cells undergoing transdifferentiation. Vet Pathol 37: 328–335, 2000. - PubMed

Publication types

MeSH terms