Comparative Study
. 2010 Mar;298(3):F712-20.
doi: 10.1152/ajprenal.00433.2009. Epub 2010 Jan 13.

Dietary fructose causes tubulointerstitial injury in the normal rat kidney

Affiliations
Comparative Study

Dietary fructose causes tubulointerstitial injury in the normal rat kidney

Takahiro Nakayama et al. Am J Physiol Renal Physiol. 2010 Mar.

Abstract

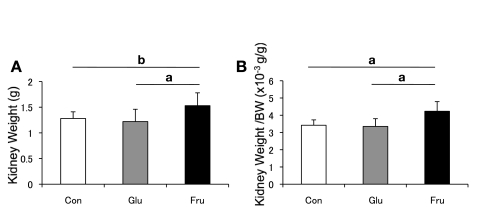
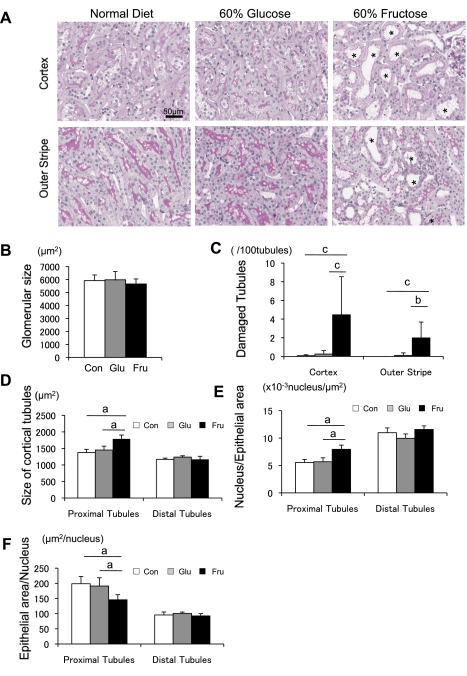
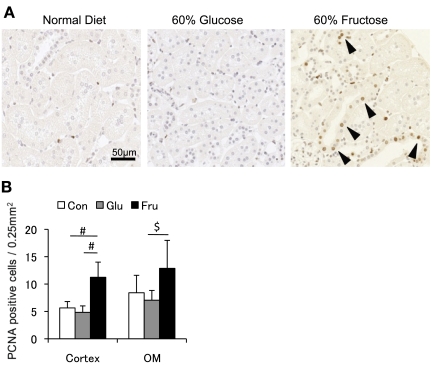
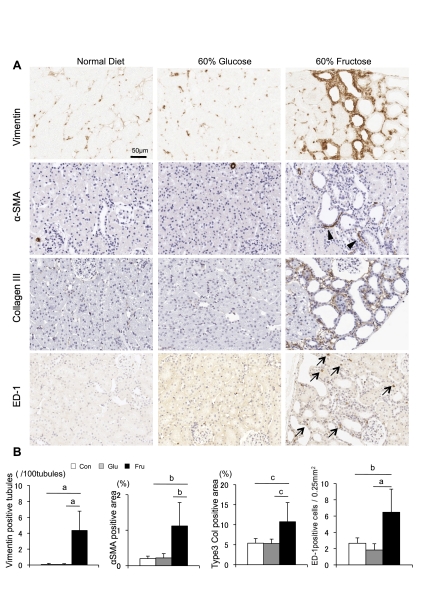
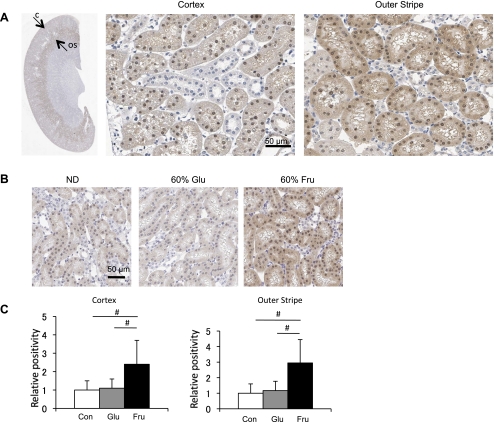
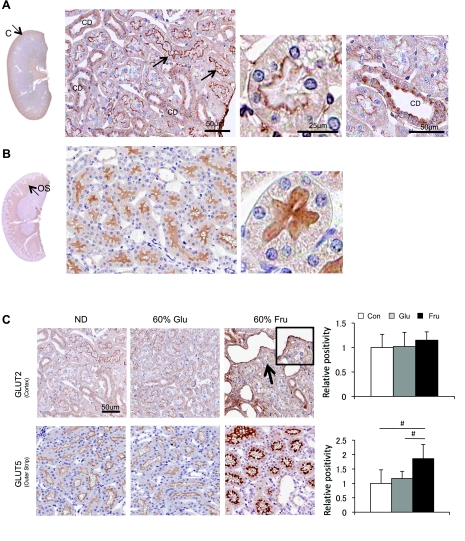
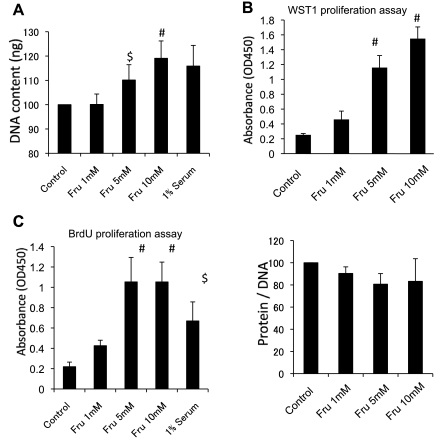
Recent studies suggest that the metabolic syndrome is associated with renal disease. We previously reported that a high-fructose diet, but not a high-glucose diet, can induce metabolic syndrome and accelerate chronic renal disease in rats. We now examined the effects of a high-fructose diet on normal rat kidneys. Three groups of Sprague-Dawley rats were pair fed a special diet containing 60% fructose, 60% glucose, or control standard rat chow for 6 wk, and then histological studies were performed. The effect of fructose to induce cell proliferation in cultured proximal tubular cells was also performed. Fructose diet, but not glucose diet, significantly increased kidney weight by 6 wk. The primary finding was tubular hyperplasia and proliferation involving all segments of the proximal tubules while glomerular changes were not observed. This is the same site where the fructose transporters (GLUT2 and -5) as well as the key enzyme in fructose metabolism (ketohexokinase) were expressed. Consistently, fructose also induced proliferation of rat proximal tubular cells in culture. In vivo, tubular proliferation was also associated with focal tubular injury, with type III collagen deposition in the interstitium, an increase in alpha-smooth muscle actin positive myofibroblasts, and an increase in macrophage infiltration. In conclusion, a high-fructose diet induces cell proliferation and hyperplasia in proximal tubules, perhaps via a direct metabolic effect. The effect is independent of total energy intake and is associated with focal tubulointerstitial injury. These studies may provide a mechanism by which metabolic syndrome causes renal disease.


Figures

Fig. 1.
Fig. 1.
Kidney weight. A: left kidney weight of rats at 6 wk. B: kidney weight-to-body weight ratio at 6 wk. White square, control diet group; gray square, 60% glucose diet group; black square, 60% fructose diet group. Con, control; Glu, glucose; Fru, fructose. Data are shown as means ± SD. aP < 0.01; bP < 0.05.
Fig. 2.
Fig. 2.
Morphology of tubules in rat with normal, 60% glucose, and 60% fructose diet at 6 wk. A: periodic acid-Schiff (PAS) staining of renal cortex and outer stripe of outer medulla. Proximal tubular damage is significant in the cortex and outer stripe in fructose-fed rats. *Dilated tubules. Bar = 50 μm. B: glomerular tuft area. C: quantitative analysis of tubular injury in the renal cortex. D: size of proximal tubule and distal tubule in cortex. E: no. of nuclei/μm2 in the tubules. F: hypertrophy measurement as noted by the ratio of tubular epithelial cell/nucleus in proximal tubular cells. White square, control diet group; gray square, 60% glucose diet group; black square, 60% fructose diet group. Data are shown as means ± SD. aP < 0.01; bP < 0.05; cP < 0.001.
Fig. 3.
Fig. 3.
Cell proliferation in the tubulointerstitium. A: immunohistochemistry for proliferating cell nuclear antigen (PCNA) in renal cortex. Positive cells are increased in rats with 60% fructose diet. Bar = 50 μm. B: quantitative analysis for PCNA positive cells in the renal cortex and outer medulla (OM). White square, control diet group; gray square, 60% glucose diet group; black square, 60% fructose diet group. Data are shown as means ± SD. #P < 0.01; $P < 0.05.
Fig. 4.
Fig. 4.
Tubulointerstitial injury. A: immunohistochemistry for vimentin, α-smooth muscle actin (SMA), collagen III, and ED-1 in rats with normal diet, 60% glucose diet, and 60% fructose diet. Positive signal is shown by brown color. Arrowheads and arrows indicate α-SMA expression in the interstitium and an ED-1 positive macrophage, respectively. Bar = 50 μm. B: quantification of tubular vimentin expression (no. of vimentin positive tubules/100 tubules), interstitial α-SMA expression as a marker of myofibroblasts (%positive area in tubulointerstitium), interstitial collagen III deposition (%positive area in tubulointerstitium), and ED-1 positive macrophage infiltration (no. of positive cell/0.25 μm2 of tubulointerstitium). White square, control diet group; gray square, 60% glucose diet group; black square, 60% fructose diet group. Data are shown as means ± SD. aP < 0.001; bP < 0.01; cP < 0.05.
Fig. 5.
Fig. 5.
Ketohexokinase (KHK) expression in the kidney. A: immunohistochemistry for KHK in the kidney. Low-power view demonstrates KHK is strongly expressed in the S3 proximal tubules of the outer stripe of the outer medulla (arrow labeled OS), with mild expression in proximal tubules of the renal cortex (arrow labeled C) in the normal rat kidney. A high-power view demonstrates KHK expression in tubular epithelial cell of proximal tubular cell in both cortex and outer stripe. B: KHK expression following normal diet (ND), 60% glucose diet (Glu), and 60% fructose diet (Fru) at 6 wk. C: KHK expression in renal cortex and outer stripe is quantified as the %positive area where positive signal is measured beyond a threshold. White square, control diet group; gray square, 60% glucose diet group; black square, 60% fructose diet group. Data are shown as means ± SD. Bar = 50 μm. #P < 0.001.
Fig. 6.
Fig. 6.
GLUT2 and GLUT5 expression in the kidney. A: immunohistochemistry for GLUT2 (brown color). A low-power view demonstrates that GLUT2 is mainly expressed in the renal cortex. By high-power view, GLUT2 (brown color) is localized to the brush border of cortical (S1 and S2) proximal (PT) tubules and collecting duct (CD) in the normal rat kidney. B: immunohistochemistry for GLUT5. A low-power view shows GLUT5 expression in the outer stripe (OS). A high-power view demonstrates that GLUT5 is located in the brush border of the S3 proximal tubular segment in the outer stripe of the normal rat kidney. Bar = 50 μm. C: the expression of GLUT2 and GLUT5 after 6 wk of normal diet, 60% glucose diet, or 60% fructose diet. Although GLUT2 expression does not appear altered, the 60% fructose diet is associated with increased GLUT5 expression in the S3 proximal tubular cells. Bar = 50 μm. White square, control diet group; gray square, 60% glucose diet group; black square, 60% fructose diet group. Data are means ± SD. #P < 0.001.
Fig. 7.
Fig. 7.
In vitro cell proliferation assay. A: DNA content (ng/well) in NRK52E cells stimulated by varying concentrations of fructose at 24 h. B: WST-1 proliferation assay. The formazan formation in NRK25E cells was quantified at 450 nm 24 h after fructose administration. C: bromodeoxyuridine (BrdU) proliferation assay shows that fructose dose dependently stimulates cell proliferation of NRK52E cells. D: the cell protein-to-DNA ratio at 24 h after exposure to fructose in NRK52E cells. Data are shown as means ± SD. $P < 0.01 vs. control; #P < 0.05 vs. control.

Similar articles

Cited by

References

    1. Affleck JA, Helliwell PA, Kellett GL. Immunocytochemical detection of GLUT2 at the rat intestinal brush-border membrane. J Histochem Cytochem 51: 1567–1574, 2003 - PMC - PubMed
    1. Berridge MV, Herst PM, Tan AS. Tetrazolium dyes as tools in cell biology: new insights into their cellular reduction. Biotechnol Annu Rev 11: 127–152, 2005 - PubMed
    1. Burant CF, Takeda J, Brot-Laroche E, Bell GI, Davidson NO. Fructose transporter in human spermatozoa and small intestine is GLUT5. J Biol Chem 267: 14523–14526, 1992 - PubMed
    1. Burch HB, Choi S, Dence CN, Alvey TR, Cole BR, Lowry OH. Metabolic effects of large fructose loads in different parts of the rat nephron. J Biol Chem 255: 8239–8244, 1980 - PubMed
    1. Cheeseman CI. GLUT2 is the transporter for fructose across the rat intestinal basolateral membrane. Gastroenterology 105: 1050–1056, 1993 - PubMed

Publication types

MeSH terms