

Direction discrimination thresholds of vestibular and cerebellar nuclei neurons
- PMID: 20071508
- PMCID: PMC2810396
- DOI: 10.1523/JNEUROSCI.3192-09.2010
Direction discrimination thresholds of vestibular and cerebellar nuclei neurons
Abstract
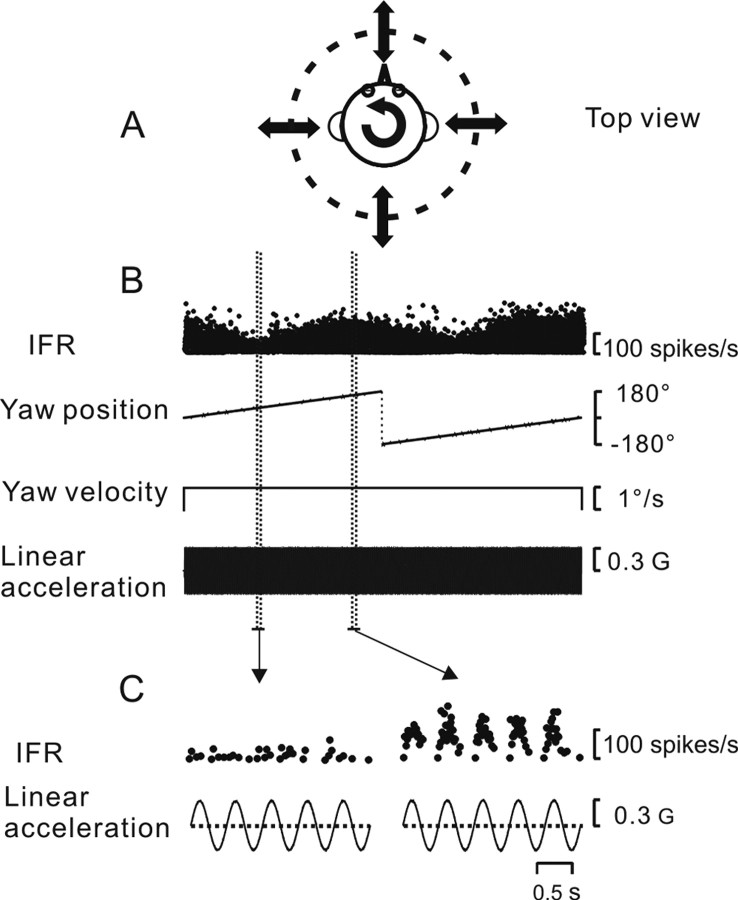
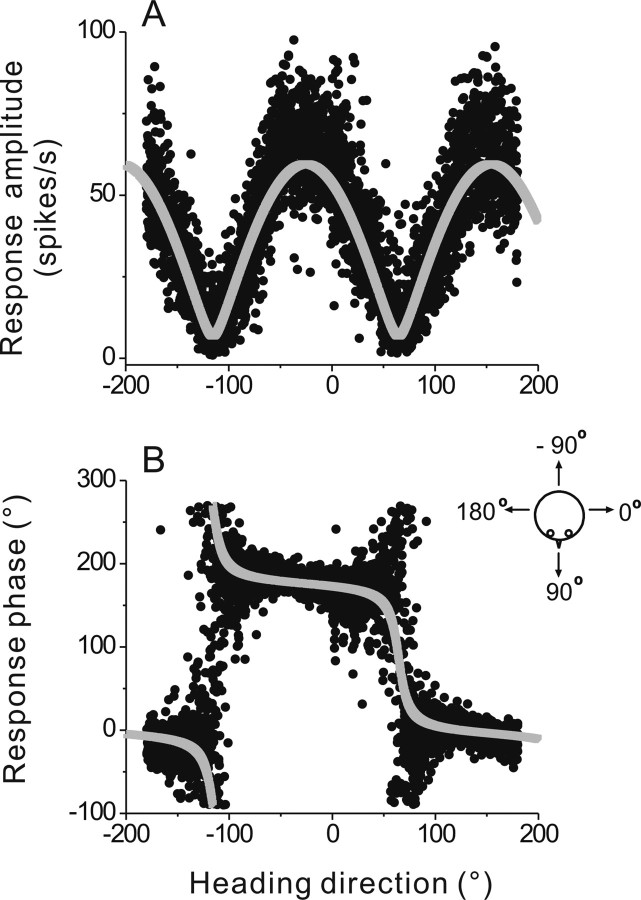
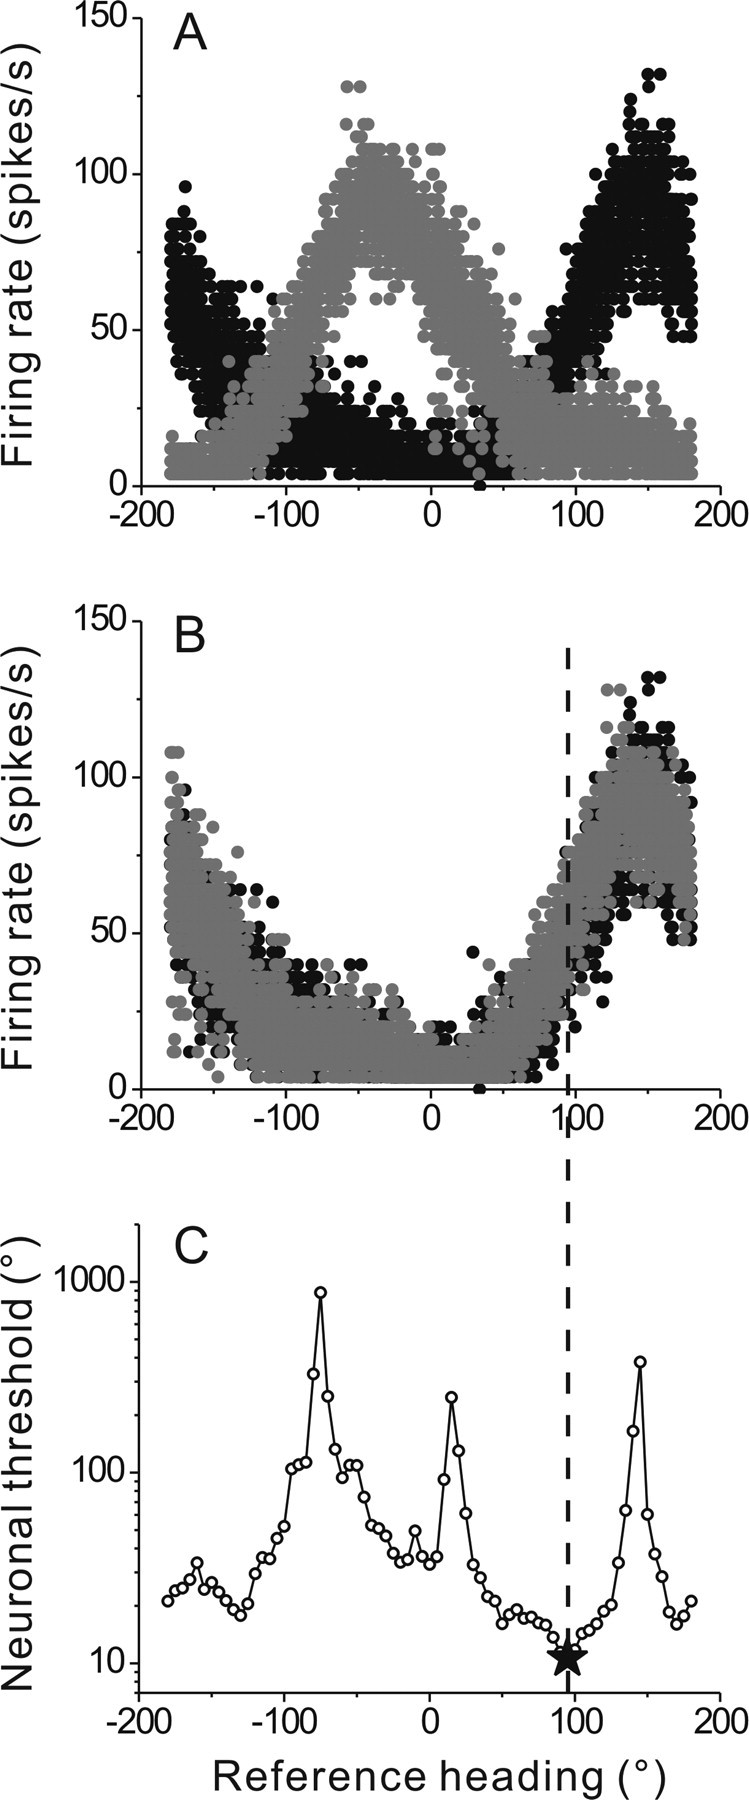
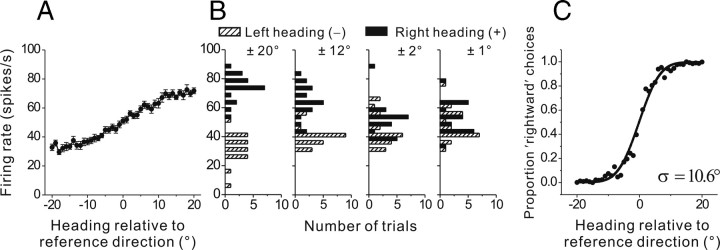
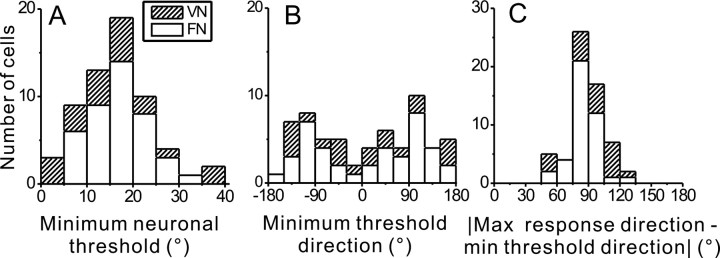
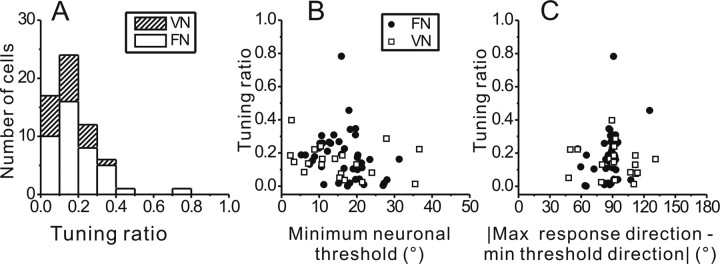
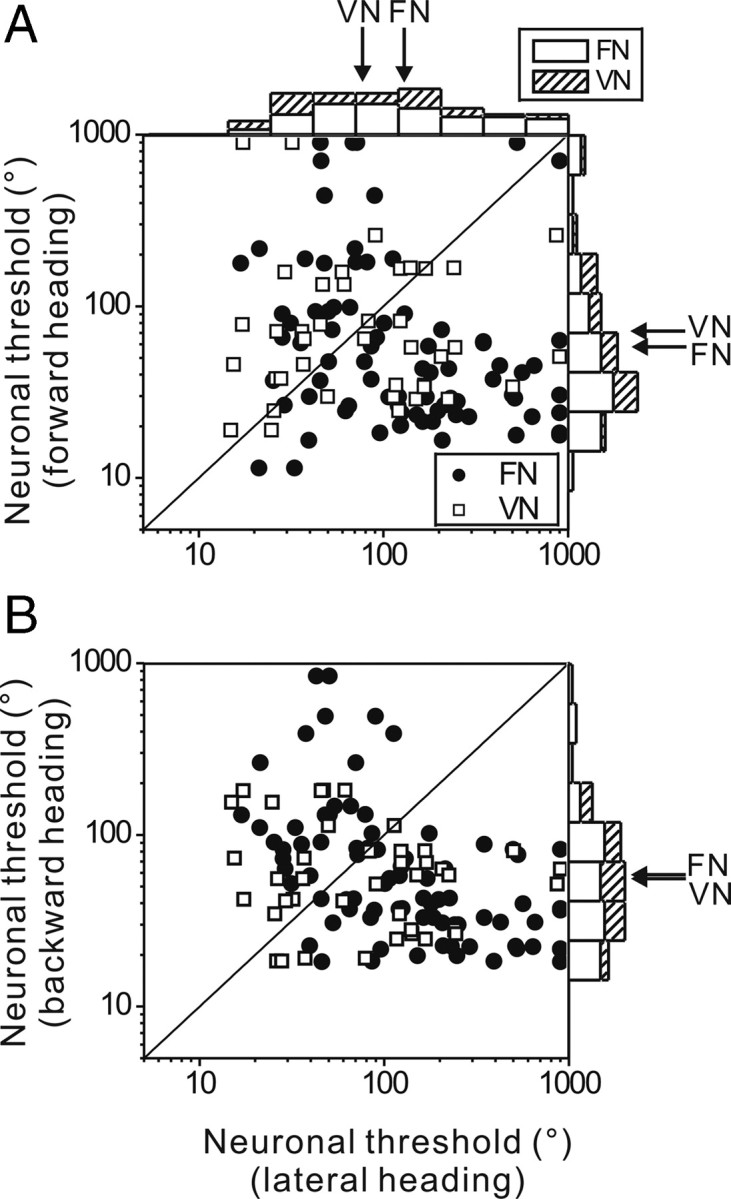
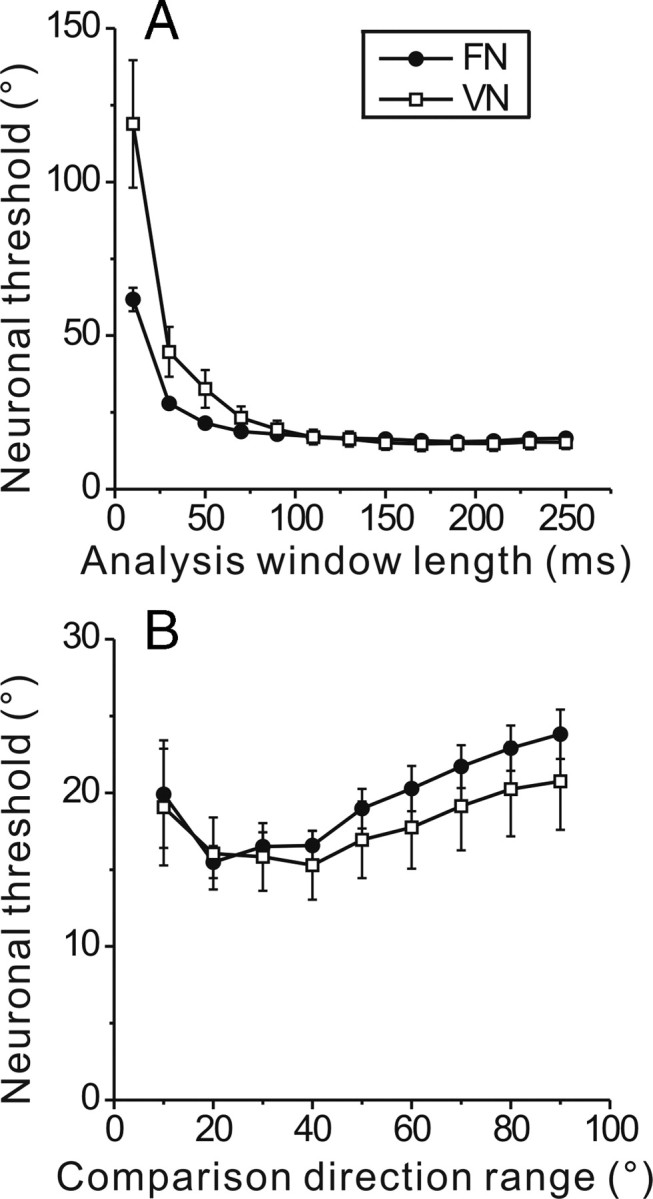
To understand the roles of the vestibular system in perceptual detection and discrimination of self-motion, it is critical to account for response variability in computing the sensitivity of vestibular neurons. Here we study responses of neurons with no eye movement sensitivity in the vestibular (VN) and rostral fastigial nuclei (FN) using high-frequency (2 Hz) oscillatory translational motion stimuli. The axis of translation (i.e., heading) varied slowly (1 degrees /s) in the horizontal plane as the animal was translated back and forth. Signal detection theory was used to compute the threshold sensitivity of VN/FN neurons for discriminating small variations in heading around all possible directions of translation. Across the population, minimum heading discrimination thresholds averaged 16.6 degrees +/- 1 degrees SE for FN neurons and 15.3 degrees +/- 2.2 degrees SE for VN neurons, severalfold larger than perceptual thresholds for heading discrimination. In line with previous studies and theoretical predictions, maximum discriminability was observed for directions where firing rate changed steeply as a function of heading, which occurs at headings approximately perpendicular to the maximum response direction. Forward/backward heading thresholds tended to be lower than lateral motion thresholds, and the ratio of lateral over forward heading thresholds averaged 2.2 +/- 6.1 (geometric mean +/- SD) for FN neurons and 1.1 +/- 4.4 for VN neurons. Our findings suggest that substantial pooling and/or selective decoding of vestibular signals from the vestibular and deep cerebellar nuclei may be important components of further processing. Such a characterization of neural sensitivity is critical for understanding how early stages of vestibular processing limit behavioral performance.
Figures
Similar articles
-
Optokinetic and vestibular responsiveness in the macaque rostral vestibular and fastigial nuclei.J Neurophysiol. 2009 Feb;101(2):714-20. doi: 10.1152/jn.90612.2008. Epub 2008 Dec 10. J Neurophysiol. 2009. PMID: 19073813 Free PMC article.
-
Properties of cerebellar fastigial neurons during translation, rotation, and eye movements.J Neurophysiol. 2005 Feb;93(2):853-63. doi: 10.1152/jn.00879.2004. Epub 2004 Sep 15. J Neurophysiol. 2005. PMID: 15371498
-
Vestibular heading discrimination and sensitivity to linear acceleration in head and world coordinates.J Neurosci. 2010 Jul 7;30(27):9084-94. doi: 10.1523/JNEUROSCI.1304-10.2010. J Neurosci. 2010. PMID: 20610742 Free PMC article.
-
Visual and vestibular cue integration for heading perception in extrastriate visual cortex.J Physiol. 2011 Feb 15;589(Pt 4):825-33. doi: 10.1113/jphysiol.2010.194720. Epub 2010 Aug 2. J Physiol. 2011. PMID: 20679353 Free PMC article. Review.
-
Internal models and neural computation in the vestibular system.Exp Brain Res. 2010 Jan;200(3-4):197-222. doi: 10.1007/s00221-009-2054-4. Exp Brain Res. 2010. PMID: 19937232 Free PMC article. Review.
Cited by
-
Temporal and spatial properties of vestibular signals for perception of self-motion.Front Neurol. 2023 Sep 13;14:1266513. doi: 10.3389/fneur.2023.1266513. eCollection 2023. Front Neurol. 2023. PMID: 37780704 Free PMC article. Review.
-
Flexible egocentric and allocentric representations of heading signals in parietal cortex.Proc Natl Acad Sci U S A. 2018 Apr 3;115(14):E3305-E3312. doi: 10.1073/pnas.1715625115. Epub 2018 Mar 19. Proc Natl Acad Sci U S A. 2018. PMID: 29555744 Free PMC article.
-
Effects of Deep Brain Stimulation on Eye Movements and Vestibular Function.Front Neurol. 2018 Jun 12;9:444. doi: 10.3389/fneur.2018.00444. eCollection 2018. Front Neurol. 2018. PMID: 29946295 Free PMC article. Review.
-
Long-term deficits in motion detection thresholds and spike count variability after unilateral vestibular lesion.J Neurophysiol. 2014 Aug 15;112(4):870-89. doi: 10.1152/jn.00280.2014. Epub 2014 May 21. J Neurophysiol. 2014. PMID: 24848470 Free PMC article.
-
Detection thresholds of macaque otolith afferents.J Neurosci. 2012 Jun 13;32(24):8306-16. doi: 10.1523/JNEUROSCI.1067-12.2012. J Neurosci. 2012. PMID: 22699911 Free PMC article.
References
-
- Abbott LF, Dayan P. The effect of correlated variability on the accuracy of a population code. Neural Comput. 1999;11:91–101. - PubMed
-
- Adeyemo B, Gu Y, Fetsch C, Angelaki DE, Deangelis GC. Population activity in area MSTd can account for the eccentricity dependence of heading discrimination based on vestibular cues. Soc Neurosci Abstr. 2007;33:399.19.
-
- Akbarian S, Grüsser OJ, Guldin WO. Thalamic connections of the vestibular cortical fields in the squirrel monkey (Saimiri sciureus) J Comp Neurol. 1992;326:423–441. - PubMed
-
- Angelaki DE. Dynamic polarization vector of spatially tuned neurons. IEEE Trans Biomed Eng. 1991;38:1053–1060. - PubMed
-
- Angelaki DE. Spatio-temporal convergence (STC) in otolith neurons. Biol Cybern. 1992;67:83–96. - PubMed
Publication types
MeSH terms
Grants and funding
LinkOut - more resources
Full Text Sources
Miscellaneous