. 2010 Jan 13;30(2):478-90.
doi: 10.1523/JNEUROSCI.5154-09.2010.

Activin potentiates proliferation in mature avian auditory sensory epithelium

Affiliations

Activin potentiates proliferation in mature avian auditory sensory epithelium

Jennifer S McCullar et al. J Neurosci. .

Abstract

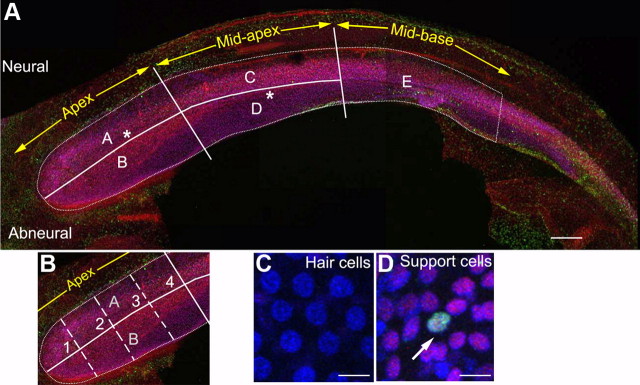
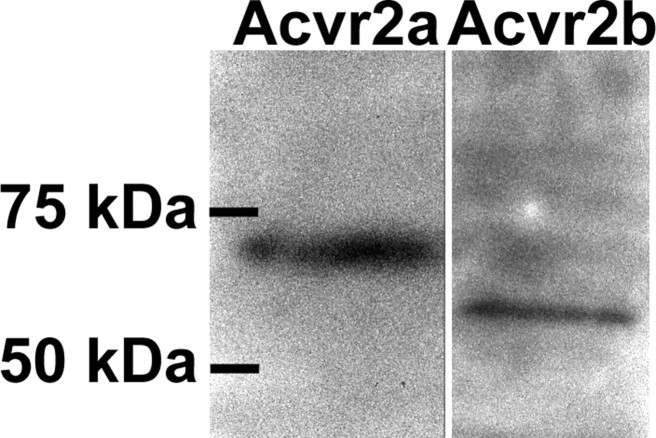
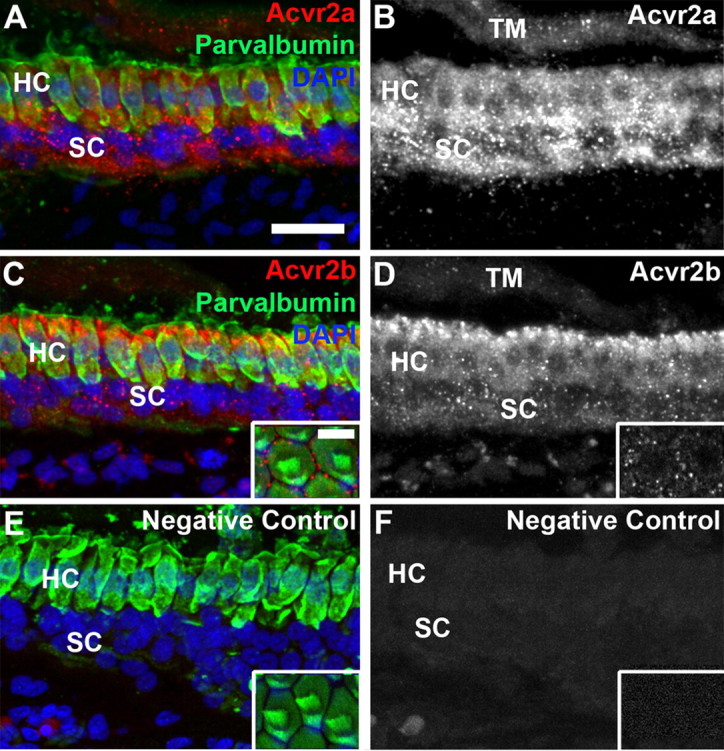
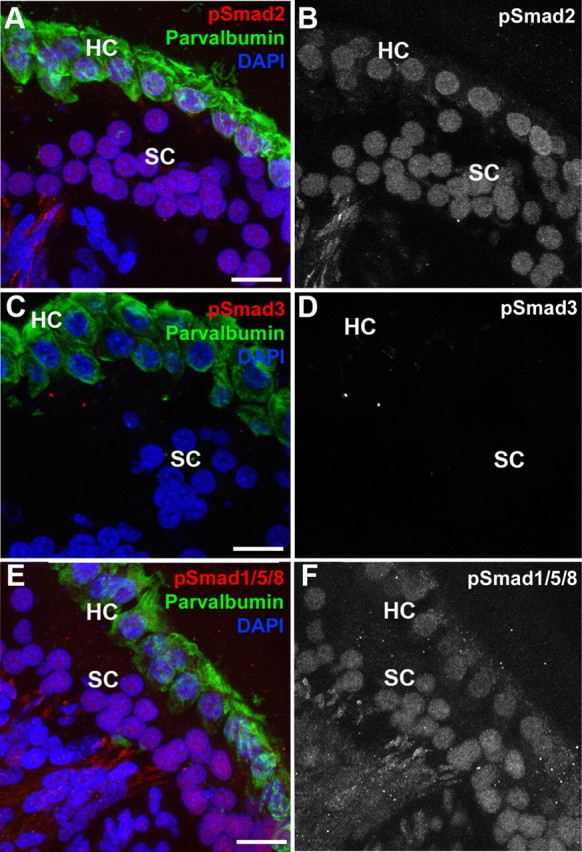
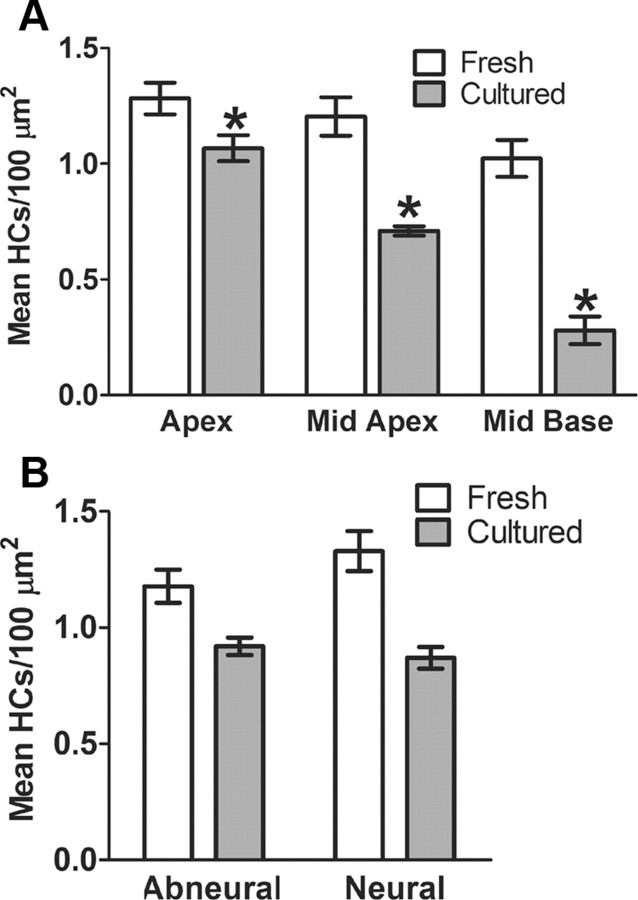
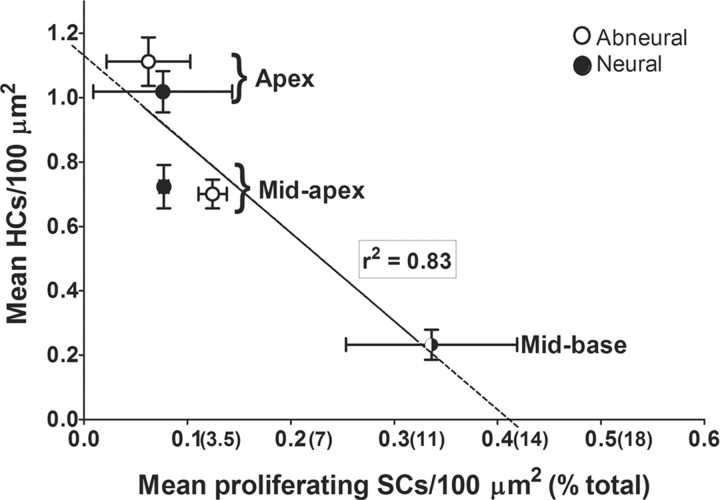
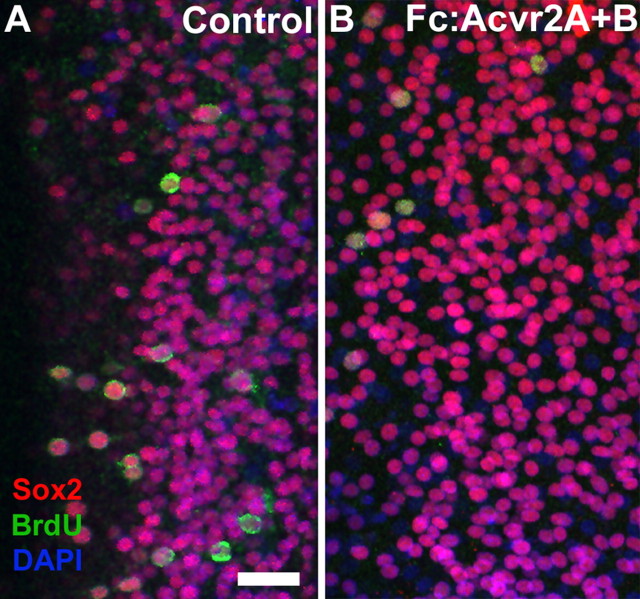
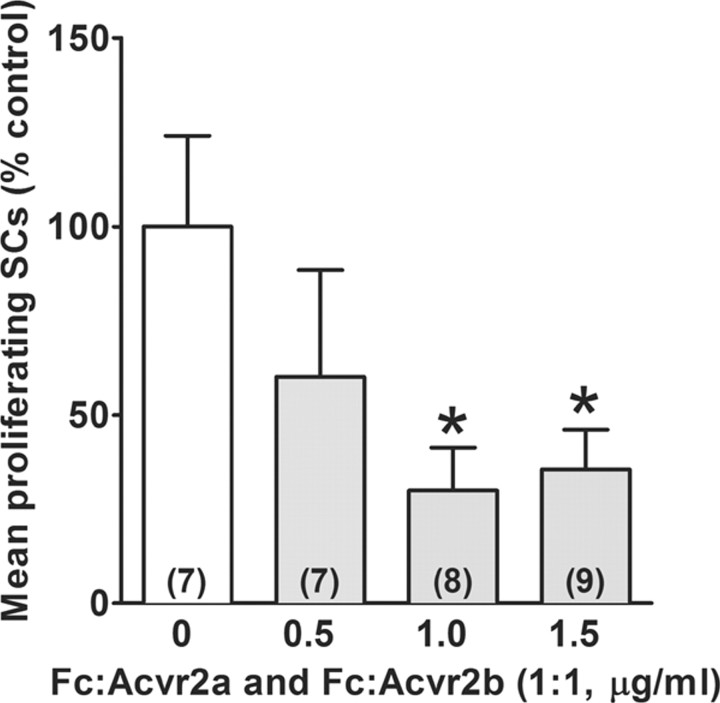
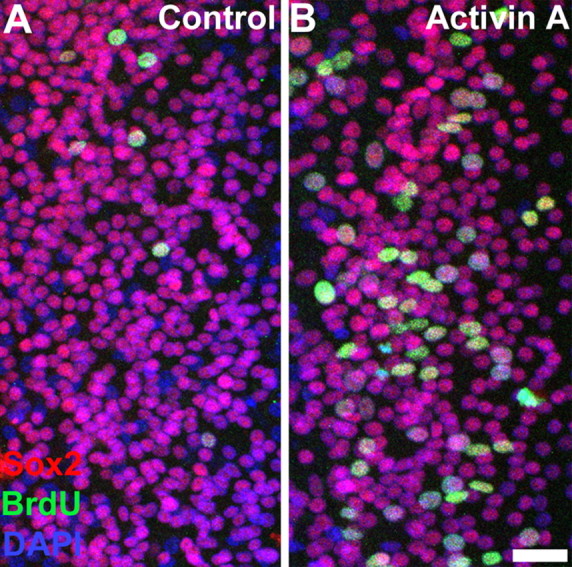
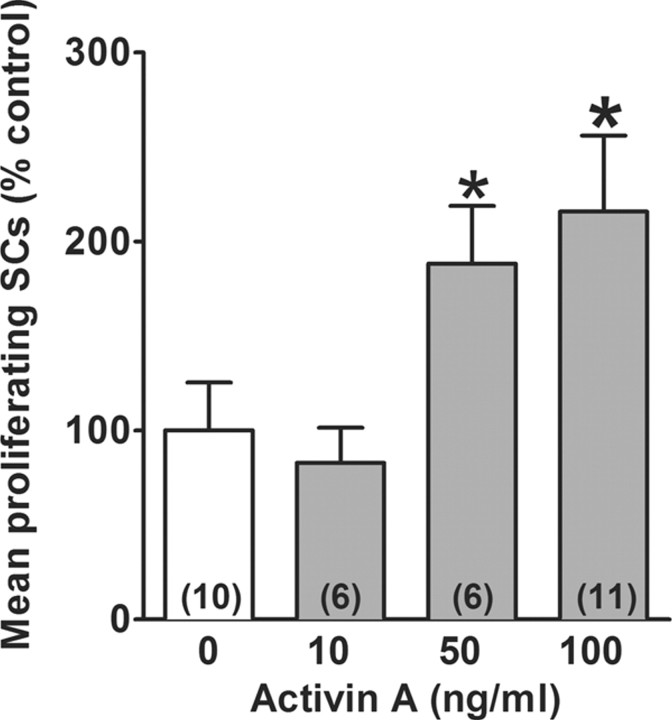
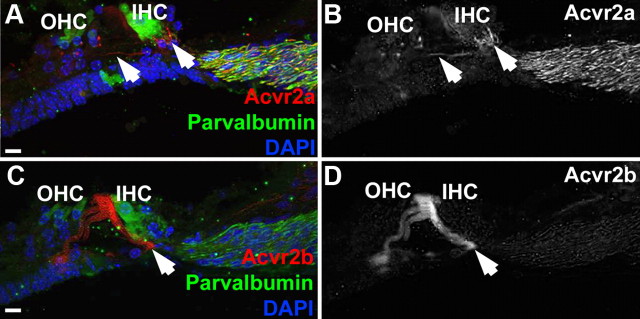
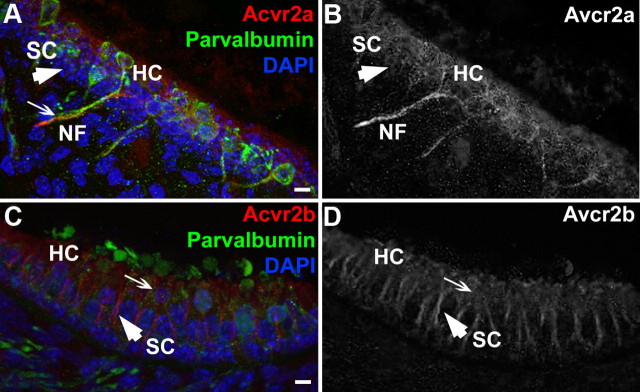
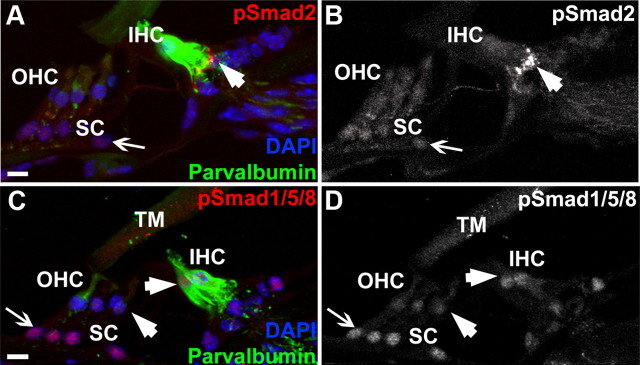
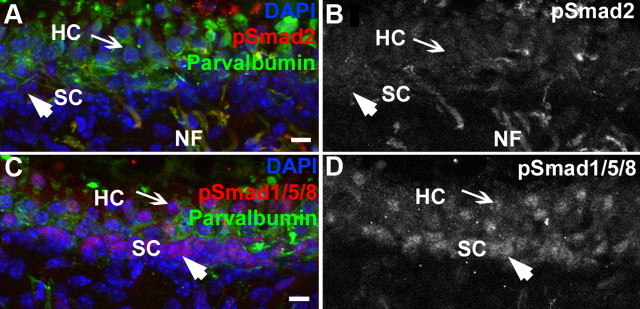
Humans and other mammals are highly susceptible to permanent hearing and balance deficits due to an inability to regenerate sensory hair cells lost to inner ear trauma. In contrast, nonmammalian vertebrates, such as birds, robustly regenerate replacement hair cells and restore hearing and balance functions to near-normal levels. There is considerable interest in understanding the cellular mechanisms responsible for this difference in regenerative capacity. Here we report on involvement of the TGFbeta superfamily type II activin receptors, Acvr2a and Acvr2b, in regulating proliferation in mature avian auditory sensory epithelium. Cultured, posthatch avian auditory sensory epithelium treated with Acvr2a and Acvr2b inhibitors shows decreased proliferation of support cells, the cell type that gives rise to new hair cells. Conversely, addition of activin A, an Acvr2a/b ligand, potentiates support cell proliferation. Neither treatment (inhibitor or ligand) affected hair cell survival, suggesting a specific effect of Acvr2a/b signaling on support cell mitogenicity. Using immunocytochemistry, Acvr2a, Acvr2b, and downstream Smad effector proteins were differentially localized in avian and mammalian auditory sensory epithelia. Collectively, these data suggest that signaling through Acvr2a/b promotes support cell proliferation in mature avian auditory sensory epithelium and that this signaling pathway may be incomplete, or actively blocked, in the adult mammalian ear.


Figures

Figure 1.
Figure 1.
Whole-mount preparation of the basilar papilla illustrating the sampling method used for quantification. Basilar papillae from posthatch (P7–P14) chickens were cultured for 3 d in medium supplemented with the cell proliferation marker BrdU before being fixed and immunolabeled for BrdU (green) and the SC marker Sox2 (red) and having their nuclei counterstained with DAPI (blue). HCs, proliferating SCs, and total numbers of SCs were quantified using a nonbiased sampling method to assess HC survival and SC proliferation. A, Representative cultured basilar papilla, imaged with confocal microscopy, illustrates the immunolabeling and sampling method. Regions indicated by the asterisks are shown at higher magnification in C and D to illustrate the Sox2 labeling pattern within the sensory epithelium. The Sox2 label (red) delineates the lateral and lower borders of the sensory epithelium, because Sox2 labels auditory SCs, but not hyaline cells, clear cells, or most stromal cells (Oesterle et al., 2008). The apical three-fourths of the papilla, the area outlined by the thin white dotted line, was analyzed, because the epithelium lies relatively flat in this region and accurate cell counts are possible. This area was divided into five regions (regions A to E), and each region was then subdivided into four smaller quadrants (quadrants 1–4), as illustrated in A and B. The quadrant to be imaged by confocal microscopy (at a magnification of 60×) and quantitatively analyzed was randomly selected before beginning the data collection and was maintained for all five regions (A to E) of the organ. C, This high-magnification image of the region marked by the leftmost asterisk is a brightest-point projection from a z series spanning the HC layer. Auditory HCs do not express Sox2, and they have distinct round nuclei, identifiable with the blue DAPI stain, that are located in the lumenal half of the SE above the SC nuclear layer. D, This high-magnification image of the region marked by the rightmost asterisk is a brightest-point projection from a z series that spans the SC layer. Sox2 labels auditory SCs. The Sox2+/BrdU+ SC (white arrow) is an example of a proliferating SC. Scale bars: A, B, 150 μm; C, D, 10 μm.
Figure 2.
Figure 2.
Western blot analysis of activin receptor antibodies used for this study. Figure shows representative Western blots of Acvr2a (left) and Acvr2b (right) in cochlear ducts taken from normal P10 chicks. Immunoblots are of solubilized extracts from two cochlear ducts (from 2 different animals) per lane. The results indicate that the activin receptors are expressed in the chicken cochlear duct and are detectable as single specific bands corresponding to the molecular weights of ∼66 and 72 kDa, respectively.
Figure 3.
Figure 3.
Activin receptors are expressed in support cells and hair cells in mature chicken auditory sensory epithelium. Cryostat sections and whole-mount preparations of auditory sensory epithelium from P7–P14 chickens imaged with confocal microscopy. Cryostat sections are from the apical region and images from whole-mount preparations are from the mid-base region of the papillae. Left panels (A, C) are labeled with antibody specific to Acvr2a (A, red) or Acvr2b (C, red), an antibody specific to the HC marker parvalbumin (green), and the nuclear counterstain DAPI (blue). Right panels (B, D) are the red channels alone (receptor-specific antibody) in grayscale. A, B, Acvr2a protein is expressed in SCs and HCs. Some nonspecific labeling is seen in the tectorial membrane (TM). C, D, Acvr2b protein is expressed in support cells and hair cells. C, Inset, Lumenal surface of the epithelium. Stereociliary bundles can be seen on hair cell surfaces. Note the punctate Acvr2a labeling (red) in apical processes of support cells in between the hair cells. E, F, Negative control tissue processed identically to experimental tissue, except it was not exposed to primary antibody for Acvr2a or Acvr2b. Control tissue was imaged at the same conditions set for digital capture as those for the experimental tissue. Scale bars: (in A) A–F, 20 μm; (in C, inset) C–F, insets, 10 μm.
Figure 4.
Figure 4.
Smad protein expression in mature chicken auditory sensory epithelium. Cryostat sections of auditory sensory epithelium from P7–P14 chickens imaged with confocal microscopy. Left panels are labeled with antibody specific to pSmad2 (A, red), pSmad3 (C, red), and pSmad1/5/8 (E, red), an antibody specific to the HC marker parvalbumin (green), and the nuclear counterstain DAPI (blue). Right panels are the red channels (Smad-specific antibody) alone in grayscale. A, B, pSmad2 is expressed in SC and HC nuclei. C, D, pSmad3 expression is undetectable in posthatch chicken auditory SE. E, F, pSmad1/5/8 is expressed in support cell and hair cell nuclei. Scale bars: 10 μm.
Figure 5.
Figure 5.
Quantification of hair cell loss in organotypic cultures of normal posthatch chicken auditory sensory epithelium. Hair cell counts were obtained from freshly dissected basilar papillae (n = 12) and untreated (control) basilar papillae grown in culture for 3 d (n = 32) that were immunolabeled for the SC-specific marker Sox2. Hair cells were identified as Sox2 cells with distinct large round nuclei residing in the lumenal portion of the epithelium, above the support cell nuclear layer. Counts were obtained from five regions of the basilar papillae as described in Figure 1, and the average hair cell density was computed for the apex (regions A and B), mid-apex (C and D), and mid-base (E). Average hair cell density was also computed for the abneural (B and D) and neural (A and C) regions. Each data value represents the mean ± SEM. A, Apical–basal gradient of HC density. B, The abneural–neural gradient. Asterisk indicates significance from fresh tissue at the 0.05 level.
Figure 6.
Figure 6.
Relationship between hair cell density and proliferating support cell density in organotypic cultures of normal chicken auditory sensory epithelium. Untreated (control) basilar papillae grown in culture for 3 d (n = 32) in the presence of the cell proliferation marker BrdU were immunolabeled for BrdU and Sox2 and counterstained with DAPI. Hair cell density and proliferating support cell density were determined in five regions of each papilla (Fig. 1, regions A to E). Average density values computed for each region are plotted (neural apex, region A; abneural apex, region B; neural mid-apex, region C; abneural mid-apex, region D; mid-base, region E) with each data point representing the mean ± SEM. The solid line is a linear regression function, fitted to points between 0.07 and 0.3 proliferating SCs per 100 μm2. The dotted portion of the line represents predicted values. The x and y intercepts are 0.4 and 1.1, respectively, and the slope of the function equals −0.37. Numbers in parentheses on the x axis indicate percentages of proliferating SCs, calculated as follows: % proliferating SCs = (mean proliferating SC density/mean total SC density) × 100.
Figure 7.
Figure 7.
Blocking Acvr2 receptor signaling decreases support cell proliferation in cultured chicken auditory sensory epithelium. A, B, Photomicrographs of normal chicken basilar papilla grown in culture for 3 d in medium alone (A) and in medium supplemented simultaneously with the soluble receptors Fc:Acvr2a and Fc:Acvr2b, which bind Acvr2a/b-specific ligands with high affinity (B). BrdU was present the entire culture period. Tissues are labeled with antibody specific to Sox2 (red), an antibody specific to BrdU (green), and the nuclear counterstain DAPI (blue). The plane of focus is at the level of the SC nuclei. Images are from the mid-apex region. Fewer BrdU+/Sox2+ cells are present in the supplemented culture than in the unsupplemented control. Scale bar: (in A) A, B, 20 μm.
Figure 8.
Figure 8.
Quantification of the effects of blocking activin receptor signaling. Basilar papillae taken from normal posthatch chickens were cultured for 3 d in the absence (control) or presence of the soluble receptors Fc:Acvr2a and Fc:Acvr2b (1:1). BrdU was present the entire culture period. Proliferating support cells (Sox2+/BrdU+ cells) were quantified using the nonbiased random sampling described in Materials and Methods. Each data value represents the mean (expressed as percentage change relative to control) ± SEM. Soluble activin receptor chimeras at 1.0 μg/ml and 1.5 μg/ml concentrations attenuate SC proliferation. An asterisk indicates values significantly different from control at the 0.05 level. Numbers of cultured organs (n) are indicated in parentheses. Data are from five independent experiments.
Figure 9.
Figure 9.
Exogenous activin A increases support cell proliferation in cultured chicken auditory sensory epithelium. A, B, Photomicrographs of normal chicken basilar papilla grown in culture for 3 d in medium alone (A) and in medium supplemented with 100 ng/ml activin A (B). BrdU was present the entire culture period. Tissues are labeled with antibody specific to Sox2 (red), an antibody specific to BrdU (green), and the nuclear counterstain DAPI (blue). The plane of focus is at the level of the SC nuclei. Images are from the mid-apex region. Many BrdU-positive/Sox2-positive cells are present in the activin A-supplemented cultures, in contrast to the unsupplemented controls. Scale bar: (in B) A, B, 20 μm.
Figure 10.
Figure 10.
Quantification of activin A's effects on support cell proliferation. Basilar papillae taken from normal posthatch chickens were cultured for 3 d in the absence (control) or presence of the ligand activin A. BrdU was present the entire culture period. Proliferating support cells (Sox2+/BrdU+ cells) were quantified using the nonbiased random sampling method. Each data value represents the mean (expressed as percentage change relative to control) ± SEM. Activin A (at 50 and 100 ng/ml) potentiates support cell proliferation. Asterisks indicate values significantly different from control at the 0.05 level. Numbers of cultured organs (n) are indicated in parentheses. Data are from three independent experiments.
Figure 11.
Figure 11.
Acvr2a and Acvr2b expression is limited in adult mouse auditory sensory epithelium. Shown are confocal images of cryostat sections from normal adult mouse organ of Corti labeled for Acvr2a or Acvr2b (red) and the HC marker parvalbumin (green) and counterstained for DAPI (blue). Acvr2 label alone, in grayscale, is shown in the right panels (B, D) to illustrate the labeling pattern. A, B, Acvr2a is expressed in peripheral nerve fiber processes lying within the osseous spiral lamina and processes innervating IHCs and OHCs (arrowheads). Acvr2a is expressed in spiral ganglion cell bodies (data not shown). C, D, Inner and outer pillar cells (arrowhead) express Acvr2b. Scale bars: 10 μm.
Figure 12.
Figure 12.
Acvr2a and Acvr2b are expressed in adult mouse vestibular sensory epithelium. Shown are confocal images of cryostat sections from normal adult mouse utricles labeled for Acvr2a or Acvr2b (red) and the HC marker parvalbumin (green) and counterstained for DAPI (blue). Acvr2 label alone, in grayscale, is shown in the right panels (B, D) to illustrate the labeling pattern. A, B, Acvr2a is expressed in SCs (arrowhead), HCs, and nerve fibers (NF, arrow). C, D, Acvr2b protein is strongly expressed in support cells (arrowhead) and weakly expressed in hair cells (arrow). Scale bars: 10 μm.
Figure 13.
Figure 13.
pSmad2 and pSmad1/5/8 are expressed in adult mouse auditory sensory epithelium. Cryostat sections from normal adult mouse organ of Corti imaged with confocal microscopy. Left panels are immunolabeled for pSmad2 (A, red) or pSmad1/5/8 (C, red) and the HC marker parvalbumin (green) and counterstained with DAPI (blue). Right panels are the red channels (Smad-specific antibody) alone in grayscale. A, B, pSmad2 is weakly expressed in SC (arrow) and HC nuclei. It is strongly expressed near the IHC synaptic region (arrowhead). C, D, pSmad1/5/8 is expressed in SC (arrow) and HC nuclei (arrowheads). Artifactual, nonspecific label is present in the tectorial membrane (TM). Scale bars: 10 μm.
Figure 14.
Figure 14.
pSmad2 and pSmad1/5/8 are expressed in adult mouse vestibular sensory epithelium. Left panels show confocal images of cryostat sections taken from normal adult mouse utricles labeled for pSmad2 (A, red) or pSmad1/5/8 (C, red) and the HC marker parvalbumin (green) and counterstained with DAPI (blue). Right panels are the red channels alone (Smad-specific antibody) in grayscale. A, B, pSmad2 is weakly expressed in SC (arrowhead) and HC (arrow) nuclei and cytoplasm. It is also expressed in nerve fibers (NF). C, D, pSmad1/5/8 is expressed in SC (arrowhead) and HC (arrow) nuclei. Scale bars: 10 μm.

Similar articles

Cited by

References

    1. Albertson RC, Payne-Ferreira TL, Postlethwait J, Yelick PC. Zebrafish acvr2a and acvr2b exhibit distinct roles in craniofacial development. Dev Dyn. 2005;233:1405–1418. - PubMed
    1. Bermingham-McDonogh O, Rubel EW. Hair cell regeneration: winging our way towards a sound future. Curr Opin Neurobiol. 2003;13:119–126. - PubMed
    1. Blanpain C, Lowry WE, Geoghegan A, Polak L, Fuchs E. Self-renewal, multipotency, and the existence of two cell populations within an epithelial stem cell niche. Cell. 2004;118:635–648. - PubMed
    1. Chang C, Harland RM. Neural induction requires continued suppression of both Smad1 and Smad2 signals during gastrulation. Development. 2007;134:3861–3872. - PubMed
    1. Chardin S, Romand R. Regeneration and mammalian auditory hair cells. Science. 1995;267:707–711. - PubMed

Publication types

MeSH terms

LinkOut - more resources