. 2010 Jan 13;30(2):534-44.
doi: 10.1523/JNEUROSCI.4009-09.2010.

Adaptation of reward sensitivity in orbitofrontal neurons

Affiliations

Adaptation of reward sensitivity in orbitofrontal neurons

Shunsuke Kobayashi et al. J Neurosci. .

Abstract

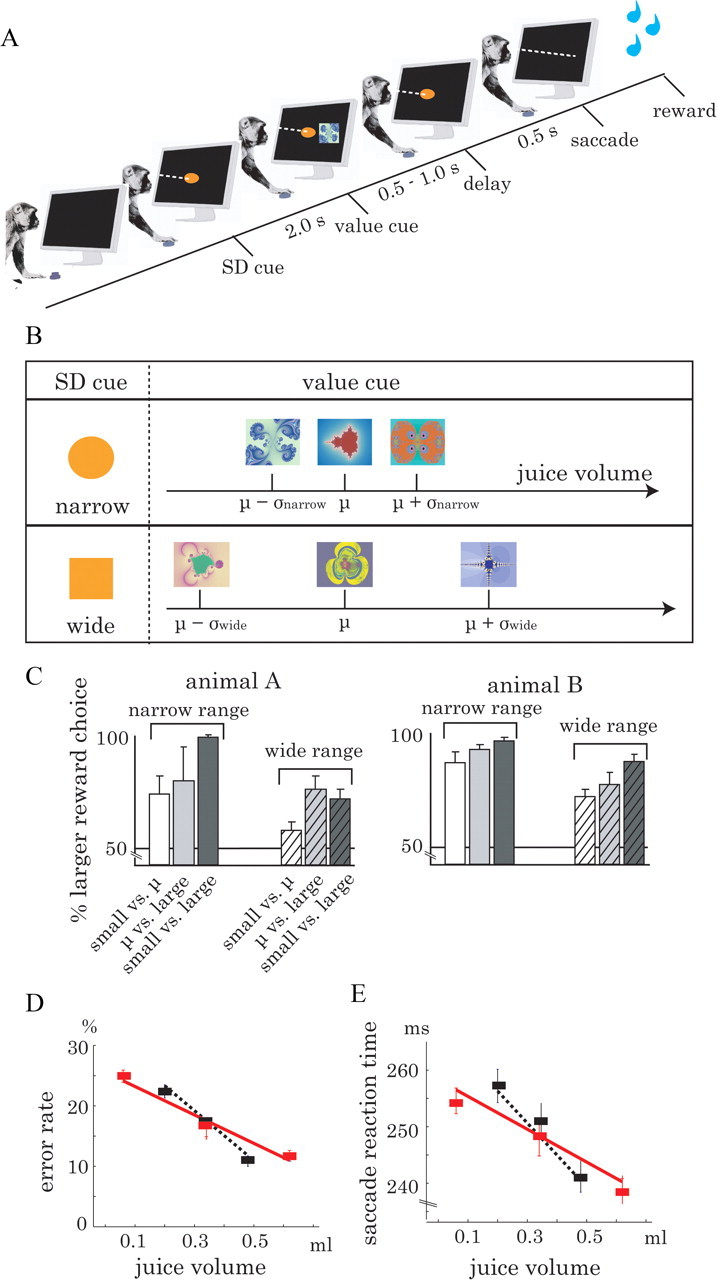
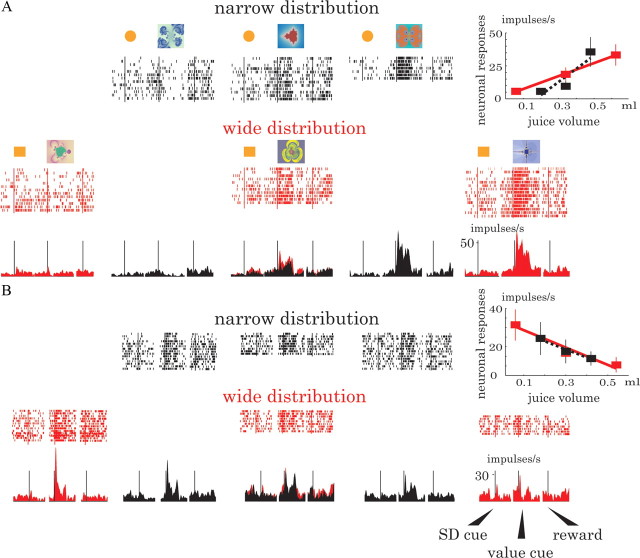
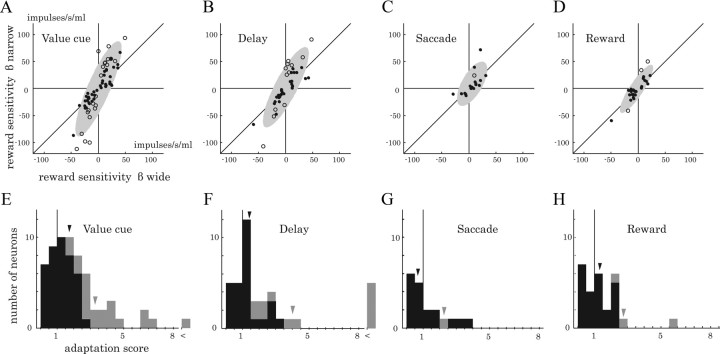
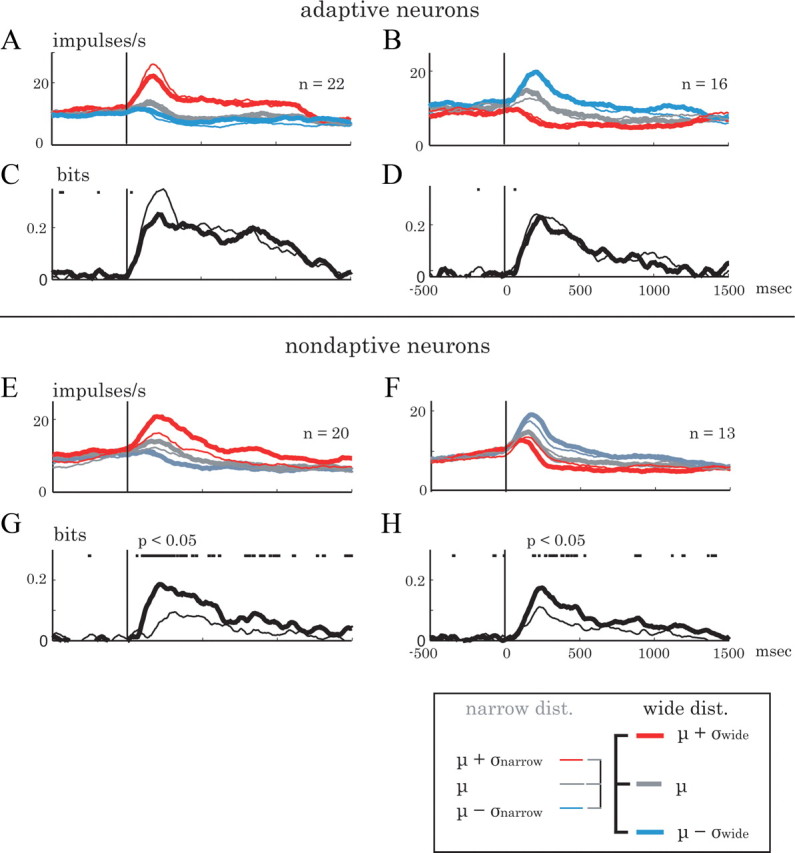
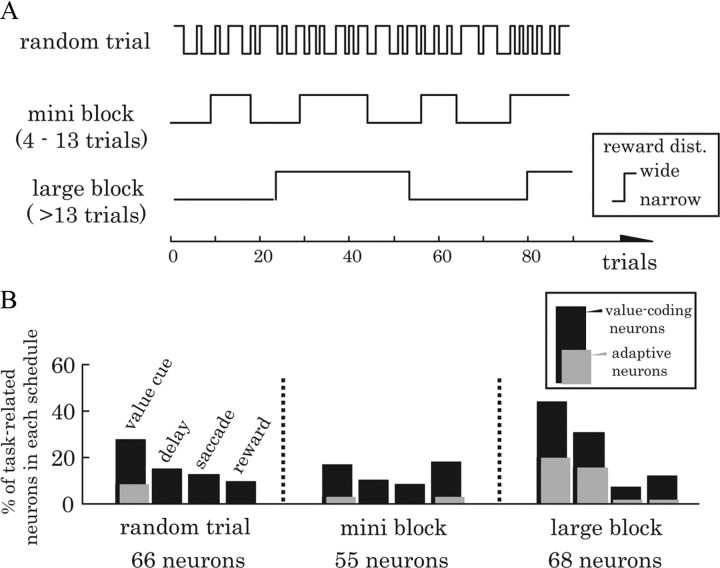
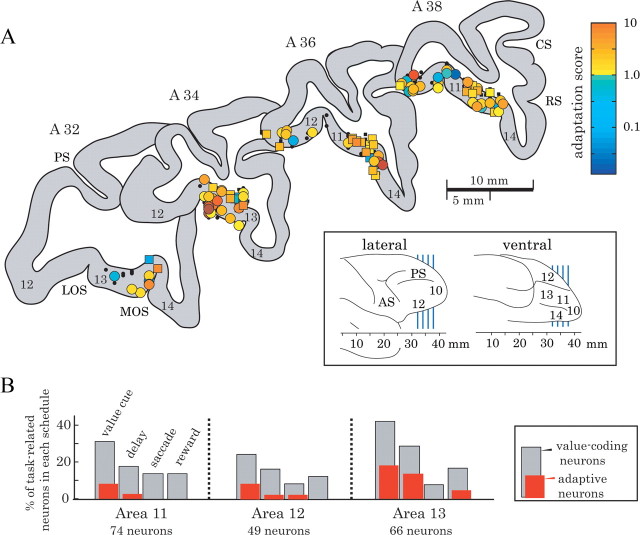
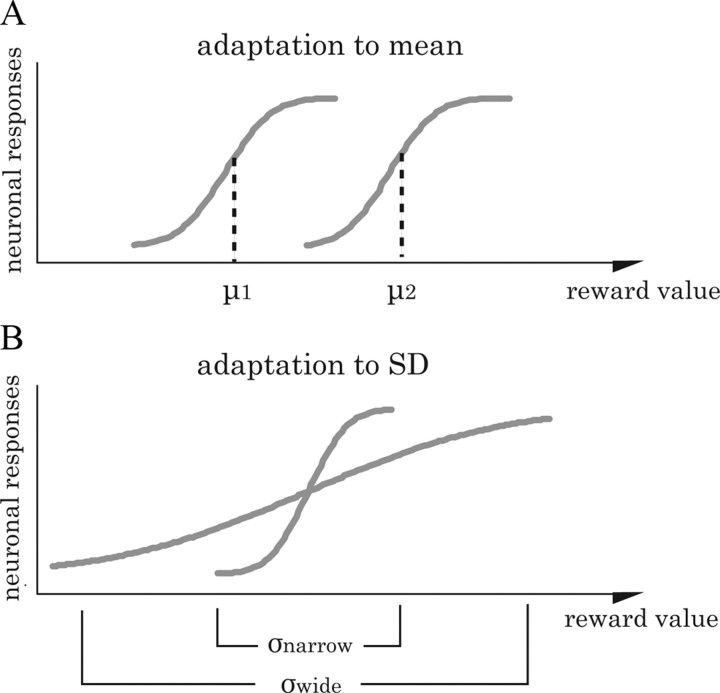
Animals depend on a large variety of rewards but their brains have a limited dynamic coding range. When rewards are uncertain, neuronal coding needs to cover a wide range of possible rewards. However, when reward is likely to occur within a specific range, focusing the sensitivity on the predicted range would optimize the discrimination of small reward differences. One way to overcome the trade-off between wide coverage and optimal discrimination is to adapt reward sensitivity dynamically to the available rewards. We investigated how changes in reward distribution influenced the coding of reward in the orbitofrontal cortex. Animals performed an oculomotor task in which a fixation cue predicted the SD of the probability distribution of juice volumes, while the expected mean volume was kept constant. A subsequent cue specified the exact juice volume obtained for a correct saccade response. Population responses of orbitofrontal neurons that reflected the predicted juice volume showed adaptation to the reward distribution. Statistical tests on individual responses revealed that a quarter of value-coding neurons shifted the reward sensitivity slope significantly between two reward distributions, whereas the remaining neurons showed insignificant change or lack of adaptation. Adaptations became more prominent when reward distributions changed less frequently, indicating time constraints for assessing reward distributions and adjusting neuronal sensitivity. The observed neuronal adaptation would optimize discrimination and contribute to the efficient coding of a large variety of potential rewards by neurons with limited dynamic range.


Figures

Figure 1.
Figure 1.
Experimental design and behavioral results. A, Imperative saccade task used for neuronal recording. A trial started when the animal touched an immobile key and gazed at the central cue that indicated the SD of the outcome reward distribution (SD cue). If the animal maintained eye fixation for 2.0 s, a peripheral picture (value cue) was presented briefly indicating the location of future saccade and the volume of upcoming juice reward. Disappearance of the SD cue signaled the monkey to make a saccade to the previously cued location. Successful saccades were followed by juice delivery at the predicted volume. B, Stimulus–reward mapping. The SD cue (left) predicted the SD of the reward distribution. Different fractal pictures (value cues, right) indicated different juice volumes. Two different SDs of reward were tested (σnarrow, σwide) with the same mean (μ). C, Animal choice behavior. Preferences to different value cues were tested in the choice saccade task. Both animals chose the cues associated with larger volumes of juice regardless of small or large SD. Error bars represent SD. D, E, Behavioral adaptation to the predicted reward distribution during the imperative saccade task. Error rate (D) and saccadic reaction time to the value cue (E) are plotted against the predicted juice volume. The shifts of the regression slope between narrow (dotted black line) and wide (solid red line) reward distributions suggest scaling of both behavioral measures to reward range. Error bars represent SEM.
Figure 2.
Figure 2.
Examples of two value-coding orbitofrontal neurons. A, Adaptation in a neuron whose response increases with increasing juice volume. The slopes in the top right regression plot show the relationships between neuronal responses (ordinate, impulses/s) and predicted juice volume (abscissa, ml), separately for small (black) and large (red) SDs. The slope changes indicate adaptation of reward sensitivity to predicted reward distribution. B, Lack of adaptation in a neuron whose response decreases with increasing juice volume. The regression lines for the two reward distributions were parallel, indicating graded coding across all five reward volumes and thus lack of adaptation. Error bar, SEM. For each raster, the sequence of trials runs from top to bottom. Vertical lines in rastergrams indicate onsets of SD cue (left), value cue (center) and reward (right). Tick marks in rastergrams indicate neuronal impulses, histograms below rastergrams display mean discharge rates (black, small SD; red, large SD).
Figure 3.
Figure 3.
Adaptations of orbitofrontal reward sensitivity to predicted reward distribution. A–D, Plots of response slopes for large versus small SD (abscissa vs ordinate). Slopes (β) of value-coding responses were estimated by linear regression models (Eqs. 1, 2) for each neuron in each task period and reflect discharge rate per unit juice volume. Each circle indicates significant (open) or insignificant (filled) slope change between the two reward distributions from each value-coding response (p = 0.05). Symbols above the diagonal unit line in the upper right quadrant and below the unit line in the lower left quadrant indicate steeper reward slope with smaller compared to larger SD (|βnarrow| > |βwide|). Shaded ellipses delineate the distribution contours (2 SD) of all value-coding responses. E–H, Histograms of adaptation scores. The adaptation score quantified the degree of adaptation and is defined as βnarrowwide. Distributions of adaptation scores were significantly shifted to >1.0 for responses to value cue and delay periods (p < 0.05, t test), indicating adaptation to SD. Black and gray arrowheads indicate median scores of all value-coding activities and statistically significant adaptive responses, respectively.
Figure 4.
Figure 4.
Population histograms of discharge rate and reward information. A, B, E, F, Average responses to value cues that showed significant (A, B) or insignificant (E, F) adaptation to SD of reward distributions. Responses varied positively (A, E) or negatively (B, F) with reward volume. Thick lines refer to large SD and thin lines to small SD of reward volume. Blue, gray, and red lines indicate small, intermediate, and large juice volumes. Juice volume increased according to thick blue < thin blue < thick gray = thin gray < thin red < thick red (inset). With adaptive responses (A, B), thick and thin lines of same color largely overlapped, indicating slope adaptation to reward range. In the population lacking significant adaptation, responses increased (E) or decreased (F) monotonically across all five physical juice volumes used. C, D, G, H, Population-averaged reward information. Thick black line, large SD of reward volume; thin gray line, small SD. Adaptive responses carried similar amount of reward information in two reward distributions (C, D). In contrast, nonadaptive responses lost reward information with small SD compared to large SD (G, H). Horizontal ticks indicate periods during which reward information was higher in the wide compared with narrow reward distribution (p < 0.05, 2-tailed paired t test, uncorrected). The mutual information was calculated using a sliding window (duration, 200 ms; step size, 5 ms) and averaged across neurons.
Figure 5.
Figure 5.
Neuronal adaptation to reward distribution during schedules of different volatility. A, Top, Narrow and wide reward distributions changed pseudorandomly in every trial. Middle, Reward distribution changed every 4–13 trials. Bottom, Reward distribution changed only between large blocks of trials (>13 trials). B, Proportions of value-coding (black bars) and adaptive (gray bars) responses in total task-related neurons sampled in each schedule (left, random trial; middle, mini block; right, large block) during different task periods (value cue, delay, saccade, reward from left to right). Total numbers of task-related neurons sampled in three schedule types are shown below schedule labels.
Figure 6.
Figure 6.
Anatomical locations of sampled orbitofrontal neurons. A, Locations of single neurons are marked with colors reflecting the adaptation score (ratio of regression slope: βnarrowwide; compare right color scale). Positions of neurons sampled from three hemispheres of two monkeys are superimposed and mapped on four coronal sections. A 32, A 34, A 36, and A 38 denote stereotaxic rostrocaudal coordinates, indicated by blue vertical lines in the inset. Circles, Animal A. Squares, Animal B. Small black symbols, Neurons related to task but not coding value. AS, Arcuate sulcus; PS, principal sulcus; LOS, lateral orbital sulcus; MOS, medial orbital sulcus; RS, rostral sulcus; CS, cingulate sulcus. Numbers on gray areas and in the inset refer to Walker's cytoarchitectonic areas. B, Proportions of value-coding (gray bars) and adaptive (red bars) responses in the whole task-related neurons sampled in each orbitofrontal subarea during different task periods (value cue, delay, saccade, and reward periods from left to right). Numbers of all task-related neurons sampled in the three areas are shown below the area labels.
Figure 7.
Figure 7.
Schematic forms of adaptation to reward distributions in orbitofrontal neurons. A, Adaptation to mean reward distribution (approximated from data by Tremblay and Schultz, 1999). Neuronal response slopes shift into the predicted distribution, rather than stretching across the full range of the two distributions combined. B, Adaptation to SD of reward distribution (current data). Neuronal response slopes become steeper with more narrow distributions, and flatten with wider distributions. The two forms of adaptation refer to different parameters of distributions but represent the same phenomenon, namely matching of neuronal responses to predicted and currently used reward distributions. The slopes reflect the quasilinear part of reward response slopes.

Similar articles

Cited by

References

    1. Barlow H. Possible principles underlying the transformation of sensory messages. In: Rosenblith WA, editor. Sensory communication. Cambridge, MA: MIT; 1961. pp. 217–234.
    1. Baylis LL, Gaffan D. Amygdalectomy and ventromedial prefrontal ablation produce similar deficits in food choice and in simple object discrimination learning for an unseen reward. Exp Brain Res. 1991;86:617–622. - PubMed
    1. Brenner N, Bialek W, de Ruyter van Steveninck R. Adaptive rescaling maximizes information transmission. Neuron. 2000;26:695–702. - PubMed
    1. Cromwell HC, Hassani OK, Schultz W. Relative reward processing in primate striatum. Exp Brain Res. 2005;162:520–525. - PubMed
    1. Dean I, Harper NS, McAlpine D. Neural population coding of sound level adapts to stimulus statistics. Nat Neurosci. 2005;8:1684–1689. - PubMed

Publication types