. 2010 Jan 13;30(2):556-67.
doi: 10.1523/JNEUROSCI.4393-09.2010.

Constitutive genetic deletion of the growth regulator Nogo-A induces schizophrenia-related endophenotypes

Affiliations

Constitutive genetic deletion of the growth regulator Nogo-A induces schizophrenia-related endophenotypes

Roman Willi et al. J Neurosci. .

Abstract

The membrane protein Nogo-A, which is predominantly expressed by oligodendrocytes in the adult CNS and by neurons mainly during development, is well known for limiting neurite outgrowth and regeneration in the injured mammalian CNS. In addition, it has recently been proposed that abnormal Nogo-A expression or Nogo receptor (NgR) mutations may confer genetic risks for neuropsychiatric disorders of presumed neurodevelopmental origin, such as schizophrenia. We therefore evaluated whether Nogo-A deletion may lead to schizophrenia-like abnormalities in a mouse model of genetic Nogo-A deficiency. Here, we show that systemic, lifelong knock-out of the Nogo-A gene can lead to specific behavioral abnormalities resembling schizophrenia-related endophenotypes: deficient sensorimotor gating, disrupted latent inhibition, perseverative behavior, and increased sensitivity to the locomotor stimulating effects of amphetamine. These behavioral phenotypes were accompanied by altered monoaminergic transmitter levels in specific striatal and limbic structures, as well as changes in dopamine D2 receptor expression in the same brain regions. Nogo-A deletion was further associated with elevated expression of growth-related markers. In contrast, acute antibody-mediated Nogo-A neutralization in adult wild-type mice failed to produce such phenotypes, suggesting that the phenotypes observed in the knock-out mice might be of developmental origin, and that Nogo-A normally subserves critical functions in neurodevelopment. This study provides the first experimental demonstration that Nogo-A bears neuropsychiatric relevance, and alterations in its expression may be one etiological factor in schizophrenia and related disorders.


Figures

Figure 1.
Figure 1.
Decreased prepulse inhibition in Nogo-A−/− mice. A, PPI is indexed by the percentage PPI at each prepulse intensity. The histogram on the right illustrates the overall means across all prepulse intensities. Magnitude of the percentage PPI increased with increasing prepulse intensity. Nogo-A−/− mice displayed reduced PPI compared with Nogo-A+/+ mice (*p < 0.05). B, Startle reactivity to pulse-alone trials in arbitrary units. There was no significant difference between the genotypes. All values are mean ± SEM. KO, Nogo-A−/− (n = 12); WT, Nogo-A+/+ (n = 12).
Figure 2.
Figure 2.
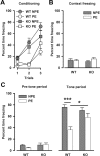
Impaired latent inhibition in Nogo-A−/− mice. A, Expression of freezing behavior toward the tone CS across the three conditioning trials immediately after pre-exposure in the conditioned freezing paradigm. Freezing is expressed as the percentage time freezing per trial. Freezing in the pre-exposed (PE) subjects was lower than in the non-pre-exposed (NPE) subjects, constituting the LI effect. B, Freezing to the context 24 h after conditioning. This is expressed as the overall mean percentage time freezing. There was no effect of genotype or pre-exposure. C, Freezing to the tone CS 48 h after conditioning. Freezing is expressed as the mean percentage time freezing before tone onset on the left and as the mean percentage time freezing across the tone period on the right. In the 3 min before the onset of the tone, there was no difference between any of the groups for the levels of freezing. Reduced freezing levels to the tone in the PE group compared with the NPE group in Nogo-A+/+ animals indicates the presence of LI (***p < 0.001 based on a priori contrast). In contrast, Nogo-A−/− mice failed to show significant LI. This difference between the genotypes was supported by the presence of a significant two-way interaction between pre-exposure and genotype (p < 0.05). Moreover, there was a genotype effect in the PE condition (*p < 0.05), whereas both NPE groups were comparable. All values are mean ± SEM. KO, Nogo-A−/− (n = 9 PE, 9 NPE); WT, Nogo-A+/+ (n = 15 PE, 15 NPE).
Figure 3.
Figure 3.
Emergence of perseverative behavior in Nogo-A−/− mice. Discrimination reversal learning in the water T-maze. Performance is expressed as the percentage correct responses per day. Acquisition of the left–right discrimination learning was similar between the genotypes. A reversal effect was evident in both groups as suggested by the below-chance performance (represented by the dashed line) on the first day of the subsequent reversal training. However, Nogo-A−/− mice displayed a clear deficit in reversal learning as evidenced by a significant genotype × day interaction (p < 0.05). All values are mean ± SEM. **p < 0.01, ***p < 0.001 based on post hoc pairwise comparisons. KO, Nogo-A−/− (n = 16); WT, Nogo-A+/+ (n = 16).
Figure 4.
Figure 4.
Social interaction and social novelty preference levels are similar in Nogo-A−/− and Nogo-A+/+ mice. A, Social interaction is indexed by the time spent in the compartment containing a stranger mouse (stranger 1) versus the time spent in the compartment containing a dummy mouse. There was a general preference for the stranger mouse. No significant difference between the genotypes was detected. B, Time spent in the compartment containing a novel stranger mouse (stranger 2) versus the first stranger mouse (stranger 1) during the social novelty task. There was a general preference for the novel stranger mouse. No significant difference between the genotypes was detected. All values are mean ± SEM. KO, Nogo-A−/− (n = 11); WT, Nogo-A+/+ (n = 11).
Figure 5.
Figure 5.
Increased sensitivity to the motor stimulant effects of systemic amphetamine in Nogo-A−/− mice. Locomotor activity in the open field is expressed as distance traveled per 5 min bin. The inset on the right illustrates the overall means across the amphetamine period. Locomotor activity for the baseline period and after vehicle (SAL, saline) injection was similar between both groups. Systemic administration of amphetamine (AMPH) resulted in a general increase in locomotor activity. The locomotor effect to the drug was potentiated in Nogo-A−/− mice compared with Nogo-A+/+ mice (*p < 0.05). All values are mean ± SEM. *p < 0.05, **p < 0.01, ***p < 0.001 in the line plot based on post hoc pairwise comparisons. KO, Nogo-A−/− (n = 9); WT, Nogo-A+/+ (n = 9).
Figure 6.
Figure 6.
Selective changes in D2R immunoreactivity in Nogo-A−/− mice. A–D, Representative images of immunostaining with D2R in the medial prefrontal cortex (A, B) and the dorsal striatum (C, D) of Nogo-A+/+ and Nogo-A−/− mice. E, Quantitative analysis of the D2R staining. The relative optical density of D2R was reduced in the medial prefrontal cortex (mPFC; *p < 0.05) of Nogo-A−/− mice, whereas it was elevated in the dorsal striatum (CPu; **p < 0.01). No changes were observed in the nucleus accumbens core (NAcC) and shell (NAcS) regions. Note the differences in staining intensity between the striatum and the medial prefrontal cortex with the typically high levels in the striatum. All values are mean ± SEM. Scale bars: A, B, 50 μm; C, D, 100 μm. KO, Nogo-A−/− (n = 6–7); WT, Nogo-A+/+ (n = 6–7).
Figure 7.
Figure 7.
Increased immunoreactivity of GAP-43 and S100 in Nogo-A−/− mice. A–D, Representative images of immunostaining with GAP-43 (A, B) and S100 (C, D) in the dentate gyrus of Nogo-A+/+ and Nogo-A−/− mice. E, F, Quantitative analysis of the respective stainings. The relative optical density of GAP-43 was enhanced in the medial prefrontal cortex (mPFC; *p < 0.05), the dentate gyrus (DG; *p < 0.05), and the CA1 region (*p < 0.05) of Nogo-A−/− mice, whereas it was not altered in the CA3 region, the dorsal striatum (CPu), and the nucleus accumbens core (NAcC) and shell (NAcS) regions (E). Similarly, S100 immunoreactivity was elevated in the mPFC (**p < 0.01) and DG (*p < 0.05) of Nogo-A−/− mice, but it was not altered in the other brain areas investigated (F). All values are mean ± SEM. Scale bar, 200 μm. KO, Nogo-A−/− (n = 6–8); WT, Nogo-A+/+ (n = 5–8).
Figure 8.
Figure 8.
No indication of reactive gliosis in Nogo-A−/− mice. A, B, Representative images of immunostaining with the astrocyte marker GFAP in the dentate gyrus of Nogo-A+/+ and Nogo-A−/− mice. C, Quantitative analysis of the GFAP staining. No difference between Nogo-A−/− and Nogo-A+/+ mice was detected in the relative optical density of GFAP. All values are mean ± SEM. Scale bar, 200 μm. DG, Dentate gyrus; mPFC, medial prefrontal cortex; CPu, dorsal striatum; NAcC, nucleus accumbens core; NAcS, nucleus accumbens shell; KO, Nogo-A−/− (n = 4–6); WT, Nogo-A+/+ (n = 4–6).
Figure 9.
Figure 9.
Absence of schizophrenia-like abnormalities in adult mice acutely treated with anti-Nogo-A antibodies for 2 weeks. A–C, Comparative regional antibody distribution in cervical spinal cord after intrathecal lumbar delivery of anti-Nogo-A or control IgG antibody via osmotic minipumps. Color coding of sections processed for immunoperoxidase staining ranges from black/dark blue, for background, to violet, red, orange, yellow, and white, for maximal staining intensity. Note the clear difference in antibody levels between the treatment groups. D, Representative image of antibody detection in the cortex of an anti-Nogo-A antibody-treated animal. Stained cell bodies reflect uptake of Nogo-A–anti-Nogo-A antibody complexes as shown earlier (Weinmann et al., 2006). E, Sensitivity of mice to the motor stimulant effects of systemic amphetamine. Locomotor activating effect of amphetamine is expressed as overall mean distance traveled during the 120 min observation period. Anti-Nogo-A antibody treatment did not significantly affect the locomotor reactivity to the drug (n = 9/group). F, G, Representative images of D2R immunostaining in the dorsal striatum of mice treated with either anti-Nogo-A or control antibodies. H, Quantitative analysis of the D2R staining. The relative optical density of D2R in the medial prefrontal cortex (mPFC), the dorsal striatum (CPu), and the nucleus accumbens core (NAcC) and shell (NAcS) regions, was not affected by the anti-Nogo-A antibody treatment (n = 5/group). All values are mean ± SEM. Scale bars: A–C, 0.5 mm; D, 20 μm; F, G, 100 μm. 11C7, Anti-Nogo-A antibody treated; IgG, control IgG treated; no pump, no pump control.

Similar articles

Cited by

References

    1. Abi-Dargham A. Alterations of serotonin transmission in schizophrenia. Int Rev Neurobiol. 2007;78:133–164. - PubMed
    1. American Psychiatric Association. Diagnostic and statistical manual of mental disorders (DSM-IV) Washington, DC: APA; 2000.
    1. Arguello PA, Gogos JA. Modeling madness in mice: one piece at a time. Neuron. 2006;52:179–196. - PubMed
    1. Bareyre FM, Haudenschild B, Schwab ME. Long-lasting sprouting and gene expression changes induced by the monoclonal antibody IN-1 in the adult spinal cord. J Neurosci. 2002;22:7097–7110. - PMC - PubMed
    1. Baruch I, Hemsley DR, Gray JA. Differential performance of acute and chronic schizophrenics in a latent inhibition task. J Nerv Ment Dis. 1988;176:598–606. - PubMed

Publication types

MeSH terms