. 2010 Mar;103(3):1418-24.
doi: 10.1152/jn.00662.2009. Epub 2010 Jan 13.

Neural correlates of sequence encoding in visuomotor learning

Affiliations

Neural correlates of sequence encoding in visuomotor learning

Yigal Agam et al. J Neurophysiol. 2010 Mar.

Abstract

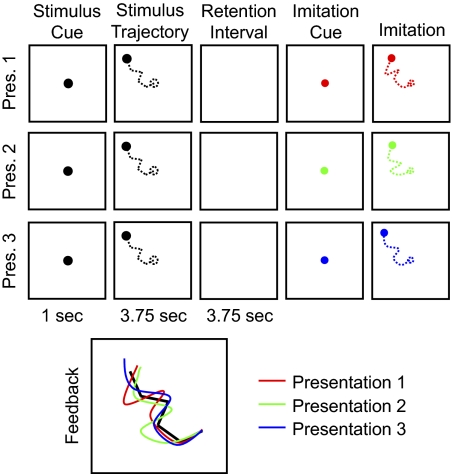
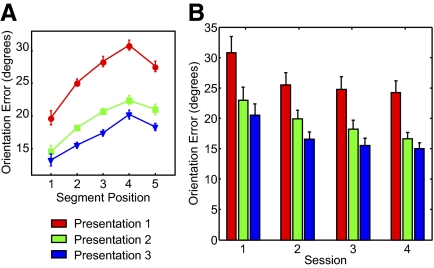
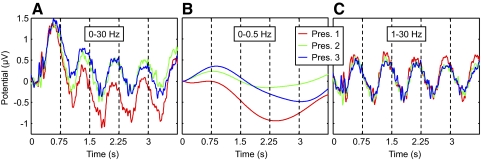
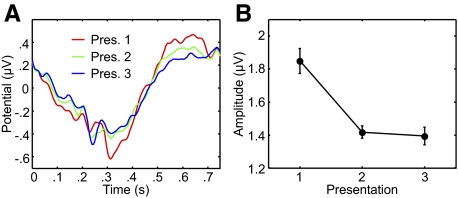
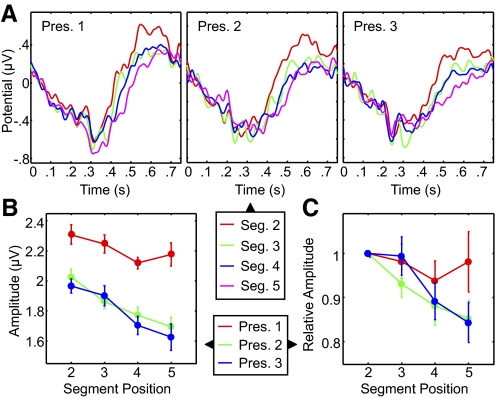
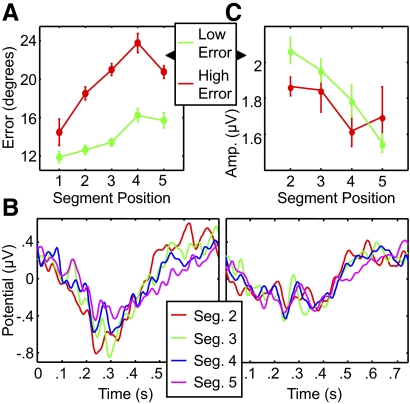
To examine the neural basis of sequence learning, a fundamental but poorly understood human ability, we recorded event-related potentials (ERPs) while subjects viewed and memorized randomly directed sequences of motions for later imitation. Previously, we found that the amplitude of ERPs elicited by successive motion segments decreased as a function of each segment's serial position. This happened when subjects were required to remember the sequence, but not when they were performing a perceptual task. Here, to study the functional significance of this amplitude gradient in sequence learning, we presented each sequence several times in succession and examined changes in ERP amplitude as subjects learned the sequence through repeated observation and imitation. Behaviorally, with each repetition subjects grew more accurate in reproducing what they had seen. At the same time, ERPs grew smaller with each successive presentation, replicating and extending previous demonstrations of repetition suppression. Importantly, a comparison of ERPs to segments occupying different serial positions within a sequence revealed a decreasing amplitude gradient that grew steeper with sequence repetition. This sharpening of the amplitude gradient may reflect an explicit encoding process that relies on a magnitude code for serial order.


Figures

Fig. 1.
Fig. 1.
Schematic diagram of the imitation task (see also Supplemental Video Clip S1). Note that the actual display background was black and the color of the disc during stimulus presentation was white. The disc never left a trace, so subjects saw only its instantaneous position; the dashed lines are for illustration purposes. The feedback image is enlarged for clarity.
Fig. 2.
Fig. 2.
Behavioral results. A: accuracy of imitation. Segment orientation error is plotted against segment serial position for each one of the stimulus presentations. Error bars are within-subject SE (Cousineau 2005; Loftus and Masson 1994). B: practice and sequence-specific effects. Each group of bars represents data from one experimental session (numbered chronologically). Ordinate values are mean error across all segments in the stimulus sequences. Red, green, and blue bars denote the first, second, and third sequence presentations, respectively. Error bars are within-subject SE for each session.
Fig. 3.
Fig. 3.
Slow-wave and evoked responses to motion sequences, time-locked to the onset of the first motion segments. A: 0–30 Hz. B: 0–0.5 Hz. C: 1–30 Hz. The red, green, and blue traces correspond to the first, second, and third presentations of each sequence, respectively. Vertical dashed lines indicate the onset of each motion segment.
Fig. 4.
Fig. 4.
Mean amplitude changes with sequence repetition. The left panel shows average event-related potentials (ERPs), filtered between 1 and 30 Hz, across 4 segments (at positions 2 to 5) of each sequence. The red, green, and blue traces correspond to the first, second, and third presentations of each sequence, respectively. The right panel shows the mean amplitude (difference between positive and negative peaks) of the ERPs for each repetition. Error bars represent within-subject SE.
Fig. 5.
Fig. 5.
Amplitude changes within repeated sequences. A: ERP waveforms for motion segments at serial positions 2 to 5, during the first (left), second (center), and third (right) sequence presentations. Data were filtered between 1 and 30 Hz. Each color corresponds to a segment at a different position. B: mean ERP amplitude (difference between positive and negative peaks) for each segment and presentation. C: ERP amplitude for each segment and repetition normalized to the amplitude of the ERP to the second segment in each presentation. Red, green, and blue lines denote first, second, and third presentations, respectively. Error bars represent within-subject SE for each repetition in B and the SE in C.
Fig. 6.
Fig. 6.
Relationship between amplitude gradient and behavioral performance. A: accuracy of the third and final imitations. Subjects were divided into 2 groups of equal size (7 subjects) based on mean orientation error: low error (green) and high error (red). B: ERPs to segments 2 to 5 in the third presentation for the better performers (left) and the worse performers (right). C: ERP amplitude (difference between positive and negative peaks) for each segment in the third presentation for each group. Error bars represent within-subject SE for each group.

References

    1. Agam Y, Bullock D, Sekuler R. Imitating unfamiliar sequences of connected linear motions. J Neurophysiol 94: 2832–2843, 2005 - PubMed
    1. Agam Y, Galperin H, Gold BJ, Sekuler R. Learning to imitate novel motion sequences. J Vis 7: 1–17, 2007 - PubMed
    1. Agam Y, Sekuler R. Interactions between working memory and visual perception: an ERP/EEG study. NeuroImage 36: 933–942, 2007 - PMC - PubMed
    1. Agam Y, Sekuler R. Geometric structure and chunking in reproduction of motion sequences. J Vis 1: 1–12, 2008 - PubMed
    1. Albouy G, Sterpenich V, Balteau E, Vandewalle G, Desseilles M, Dang-Vu T, Darsaud A, Ruby P, Luppi PH, Degueldre C, Peigneux P, Luxen A, Maquet P. Both the hippocampus and striatum are involved in consolidation of motor sequence memory. Neuron 58: 261–272, 2008 - PubMed

Publication types

LinkOut - more resources