. 2010 Feb;120(2):472-84.
doi: 10.1172/JCI39434. Epub 2010 Jan 11.

Cardiomyocyte PDGFR-beta signaling is an essential component of the mouse cardiac response to load-induced stress

Affiliations

Cardiomyocyte PDGFR-beta signaling is an essential component of the mouse cardiac response to load-induced stress

Vishnu Chintalgattu et al. J Clin Invest. 2010 Feb.

Abstract

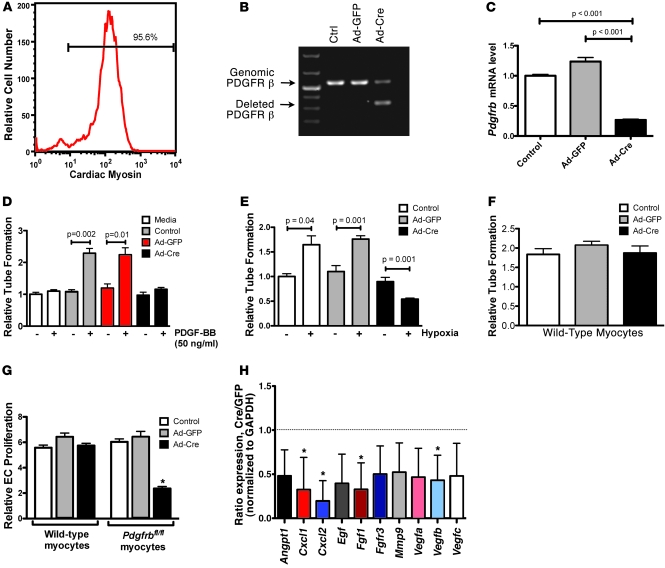
PDGFR is an important target for novel anticancer therapeutics because it is overexpressed in a wide variety of malignancies. Recently, however, several anticancer drugs that inhibit PDGFR signaling have been associated with clinical heart failure. Understanding this effect of PDGFR inhibitors has been difficult because the role of PDGFR signaling in the heart remains largely unexplored. As described herein, we have found that PDGFR-beta expression and activation increase dramatically in the hearts of mice exposed to load-induced cardiac stress. In mice in which Pdgfrb was knocked out in the heart in development or in adulthood, exposure to load-induced stress resulted in cardiac dysfunction and heart failure. Mechanistically, we showed that cardiomyocyte PDGFR-beta signaling plays a vital role in stress-induced cardiac angiogenesis. Specifically, we demonstrated that cardiomyocyte PDGFR-beta was an essential upstream regulator of the stress-induced paracrine angiogenic capacity (the angiogenic potential) of cardiomyocytes. These results demonstrate that cardiomyocyte PDGFR-beta is a regulator of the compensatory cardiac response to pressure overload-induced stress. Furthermore, our findings may provide insights into the mechanism of cardiotoxicity due to anticancer PDGFR inhibitors.


Figures

Figure 1
Figure 1. PDGFR-β expression and phosphorylation in cardiomyocytes increase dramatically in response to pressure overload stress.
(A) Heart weight/body weight ratios in 8- to 12-week-old C57BL/6 mice exposed to TAC or sham surgery (Sham). (B) Ratio of the posterior wall thickness of hearts from mice exposed to TAC versus sham surgery. Day 0 indicates baseline levels, prior to surgery. (C) Western blot of PDGFR-β levels in cardiac lysates harvested after the indicated number of days from animals exposed to TAC or sham surgery. (D) Ratio of PDGFR-β levels (normalized for GAPDH) from cardiac lysates from animals exposed to TAC versus sham surgery at the indicated time points (n = 4 samples in each group). (E) Immunohistochemical staining for PDGFR-β in cardiac sections from mice exposed to sham surgery (upper panel) or TAC for 7 days. Arrows indicate cardiomyocytes intensely stained for PDGFR-β. Results are representative of at least 3 separate, independent cardiac samples. Scale bars: 50 μm. (F) Western blot probed for phospho-/total levels of PDGFR-β, Akt, and ERK1/2 in hearts of unoperated mice (Control) or mice 7 days after TAC or sham surgery. Results are representative of 4 samples in each group. (G) Immunohistochemical staining for phospho–PDGFR-β in cardiac sections from mice exposed to sham surgery (upper panel) or TAC for 7 days. Arrows indicate cardiomyocytes intensely stained for phospho–PDGFR-β. Scale bars: 50 μm. Asterisks indicate that statistical comparison was between TAC and sham surgery at the specified time point. P values were determined by unpaired, 2-tailed Student’s t test.
Figure 2
Figure 2. Cardiac-specific PDGFR-β–knockout mice develop ventricular dilatation and heart failure in response to pressure overload.
(A) PCR of genomic DNA from tails, skeletal muscle (SM), or hearts (Hrt) from newborn cardiac-specific PDGFR-β–knockout mice (PdgfrbNkx-Cre) mice using primer pairs specific for floxed allele (upper band) or deleted allele (lower band). Results are representative of 3 independent experiments. (B) Western blot of cardiac lysates from 4-week-old Nkx2.5-Cre:Pdgfrbfl/fl mice (PdgfrbNkx-Cre) or non–Cre-expressing littermate control (Pdgfrbfl/fl) mice probed with an antibody against PDGFR-β. (C) Ratio of right/left (R/L) peak carotid velocity 24 hours after 8- to 12-week-old PdgfrbNkx-Cre or Pdgfrbfl/fl mice were exposed to TAC (n = 8 in each group). (D) Cardiac ejection fraction of Pdgfrbfl/fl mice or PdgfrbNkx-Cre mice prior to TAC (day 0) or at various time points after TAC, as measured by MRI. (E) Heart weight/body weight ratios of Pdgfrbfl/fl versus PdgfrbNkx-Cre mice prior to TAC (day 0) or 14 days after TAC. (F) Representative short-axis MRI still frame images taken at the mid-ventricular level in Pdgfrbfl/fl or PdgfrbNkx-Cre mice prior to TAC exposure (left panels) or 14 days after TAC exposure (right panels). (G) Ratio of lung weight/body weight of Pdgfrbfl/fl versus PdgfrbNkx-Cre mice prior to TAC or 14 days after TAC. P values were determined by unpaired, 2-tailed Student’s t test. Numbers inside the bars indicate the number of animals analyzed.
Figure 3
Figure 3. Inducible, cardiac-specific PDGFR-β–knockout mice develop severe heart failure in response to pressure overload.
(A) Expression of PDGFR-β in hearts from α-MHC-MerCreMer:Pdgfrbfl/fl mice (inducible, cardiac-specific PDGFR-β–knockout mice, PdgfrbMerCre) or Pdgfrbfl/fl controls harvested 7 days after exposure to tamoxifen. Results are representative of 4 independent hearts assessed from each group. (B) Ratio of right/left peak carotid velocity 24 hours after 8- to 12-week-old PdgfrbMerCre, MerCreMer, or Pdgfrbfl/fl mice were exposed to TAC. All groups of mice were treated with tamoxifen in an identical manner prior to baseline analysis and exposure to TAC stress (see Methods). (C) Heart weight/body weight ratios in 8- to 12-week-old PdgfrbMerCre, MerCreMer, or Pdgfrbfl/fl mice after TAC. (D) Cardiac ejection fraction of PdgfrbMerCre, MerCreMer, or Pdgfrbfl/fl mice prior to TAC or at time points after TAC, as measured by MRI. (E) LV end diastolic volume of PdgfrbMerCre, MerCreMer, or Pdgfrbfl/fl mice 14 days after TAC. (F) Representative hearts from Pdgfrbfl/fl or PdgfrbMerCre mice 14 days after TAC. (G) Expression levels of BNP assessed from mRNA from hearts of Pdgfrbfl/fl or PdgfrbMerCre mice prior to TAC or at time points after TAC (n = 4 samples per group at each time point). (H) Ratio of lung weight/body weight of PdgfrbMerCre, MerCreMer, or Pdgfrbfl/fl mice at baseline or at time points after TAC. P values were determined by ANOVA, and significant differences between PdgfrbMerCre and control (MerCreMer and Pdgfrbfl/fl) mice were confirmed with Tukey’s test. Numbers inside the bars indicate the number of animals analyzed.
Figure 4
Figure 4. Inducible, cardiac-specific PDGFR-β–knockout mice exhibit impaired activation of Akt and MAPK pathways in the progression to heart failure.
Representative Western blots from cardiac lysates of PdgfrbMerCre mice (inducible, cardiac-specific PDGFR-β–knockout mice) or Pdgfrbfl/fl controls harvested prior to TAC or at indicated time points after TAC probed for (A) phospho-/total p38, phospho-/total ERK1/2, and phospho/total JNK or (D) phospho-/total Akt. (B, C, and E) Quantification by densitometry (n = 4 independent samples per group per time point) of ratios of (B) phospho-/total p38, (C) phospho-/total ERK1/2, or (E) phospho-/total Akt. (F) Number of apoptotic cells per 100,000 myocytes from hearts of PdgfrbMerCre mice or Pdgfrbfl/fl controls assessed at 7 or 14 days after TAC. Data represent results from 2 spatially separated samples from 3 separate animals from each group at each time point. P values were determined by unpaired, 2-tailed Student’s t test.
Figure 5
Figure 5. Angiogenic gene expression profile correlates with defective microvascular function in inducible, cardiac-specific PDGFR-β–knockout mice upon exposure to load stress.
(A) Pattern of change of genes of interest over time prior to and after TAC (red, PdgfrbMerCre; blue, Pdgfrbfl/fl). (B) Change of expression from baseline (ratio of PdgfrbMerCre to Pdgfrbfl/fl) of genes associated with multiple aspects of angiogenesis (n = 4 samples in each group at each time point). (C) Representative ultrasound tracings of maximal coronary flow after hyperemic stimulus prior to TAC or 14 days after TAC in control Pdgfrbfl/fl or PdgfrbMerCre mice. (D) Quantification of CFR in Pdgfrbfl/fl, MerCreMer, or PdgfrbMerCre mice (n = 7 in each group at each time point). (E) Quantification of cardiac perfusion as assessed by myocardial contrast uptake (see Methods) from 0° (anterior wall of the left ventricle) to 90° (lateral wall of left ventricle) 14 days after TAC in PdgfrbMerCre or Pdgfrbfl/fl control mice (n = 3 PdgfrbMerCre mice, n = 4 Pdgfrbfl/fl control mice). P values were determined by ANOVA, and significant differences between PdgfrbMerCre and control (Pdgfrbfl/fl and MerCreMer) mice were confirmed with Tukey’s test.
Figure 6
Figure 6. Impaired angiogenesis and evidence of ischemic injury in the hearts of inducible, cardiac-specific PDGFR-β–knockout mice upon exposure to load stress.
(A) Microvessel number per cardiomyocyte in Pdgfrbfl/fl, MerCreMer, or PdgfrbMerCre mice at baseline (day 0) or at time points after TAC. (B) Representative photomicrographs of cardiac sections stained with an anti-CD31 antibody from Pdgfrbfl/fl, MerCreMer, or PdgfrbMerCre hearts 14 days after TAC. Scale bars: 100 μm. (C) Low-power (original magnification, ×15) photomicrographs of representative Masson’s trichrome–stained cardiac sections from Pdgfrbfl/fl or PdgfrbMerCre mice 14 days after TAC reveal diffuse, subendocardial fibrosis in hearts of PdgfrbMerCre exposed to load stress (upper panels). High-power photomicrographs of portion of sections in C indicated by boxed region (lower panels). Scale bars: 50 μm. (D) Representative photomicrographs of cardiac sections from PdgfrbMerCre or Pdgfrbfl/fl control mice assessed for hypoxia (see Methods) 14 days after TAC. Scale bars: 50 μm. (E) Quantification of hypoxic area in hearts of PdgfrbMerCre or Pdgfrbfl/fl control mice after TAC. Data represent mean of multiple fields from independent sections from 3 separate mice in each group at each time point.
Figure 7
Figure 7. Cardiomyocyte PDGFR-β is an upstream regulator of the paracrine angiogenic capacity of cardiomyocytes.
(A) FACS analysis of cardiomyocytes from Pdgfrbfl/fl mice stained with anti–sarcomeric myosin antibody. (B) Genomic PCR of cardiomyocytes from Pdgfrbfl/fl mice before infection (Ctrl) or after infection with Ad-GFP or Ad-Cre using primers for floxed allele (upper band) or deleted allele (lower band). (C) Quantitative RT-PCR for PDGFR-β expression (normalized to GAPDH) using RNA derived from cardiomyocytes from Pdgfrbfl/fl mice before infection (Control) or after infection with Ad-GFP or Ad-Cre. (D) Relative tube-forming capacity of conditioned media from cardiomyocytes from Pdgfrbfl/fl mice before infection (Control) or after infection with Ad-GFP or Ad-Cre with or without exogenous PDGF-BB. (E) Relative tube-forming capacity of conditioned media from cardiomyocytes from Pdgfrbfl/fl mice before infection or after infection with Ad-GFP or Ad-Cre under normoxic or hypoxic conditions. (F) Relative tube-forming capacity of conditioned media from cardiomyocytes from wild-type mice before or after infection with Ad-GFP or Ad-Cre and subsequent exposure to hypoxia. (G) Relative endothelial cell proliferation in conditioned media from wild-type and Pdgfrbfl/fl cardiomyocytes before or after infection with Ad-GFP or Ad-Cre and exposed to hypoxia. *P < 0.001. (H) Ratio of reduction in expression (quantitative RT-PCR, normalized to GAPDH) of proangiogenic genes in cardiomyocytes from Pdgfrbfl/fl mice infected with Ad-Cre or Ad-GFP and exposed to hypoxia. *P < 0.05. Data were derived from 4 independent experiments.

References

    1. Apte SM, Fan D, Killion JJ, Fidler IJ. Targeting the platelet-derived growth factor receptor in antivascular therapy for human ovarian carcinoma. Clin Cancer Res. 2004;10(3):897–908. doi: 10.1158/1078-0432.CCR-1151-3. - DOI - PubMed
    1. Ostman A, Heldin CH. Involvement of platelet-derived growth factor in disease: development of specific antagonists. Adv Cancer Res. 2001;80:1–38. - PubMed
    1. Sundberg C, Ljungstrom M, Lindmark G, Gerdin B, Rubin K. Microvascular pericytes express platelet-derived growth factor-beta receptors in human healing wounds and colorectal adenocarcinoma. Am J Pathol. 1993;143(5):1377–1388. - PMC - PubMed
    1. Uehara H, et al. Effects of blocking platelet-derived growth factor-receptor signaling in a mouse model of experimental prostate cancer bone metastases. . J Natl Cancer Inst. 2003;95(6):458–470. - PubMed
    1. Escudier B, et al. Sorafenib in advanced clear-cell renal-cell carcinoma. N Engl J Med. 2007;356(2):125–134. doi: 10.1056/NEJMoa060655. - DOI - PubMed

Publication types

MeSH terms

Substances