. 2010 Jan 28;463(7280):501-6.
doi: 10.1038/nature08675. Epub 2010 Jan 13.

Targeting Bcr-Abl by combining allosteric with ATP-binding-site inhibitors

Affiliations

Targeting Bcr-Abl by combining allosteric with ATP-binding-site inhibitors

Jianming Zhang et al. Nature. .

Abstract

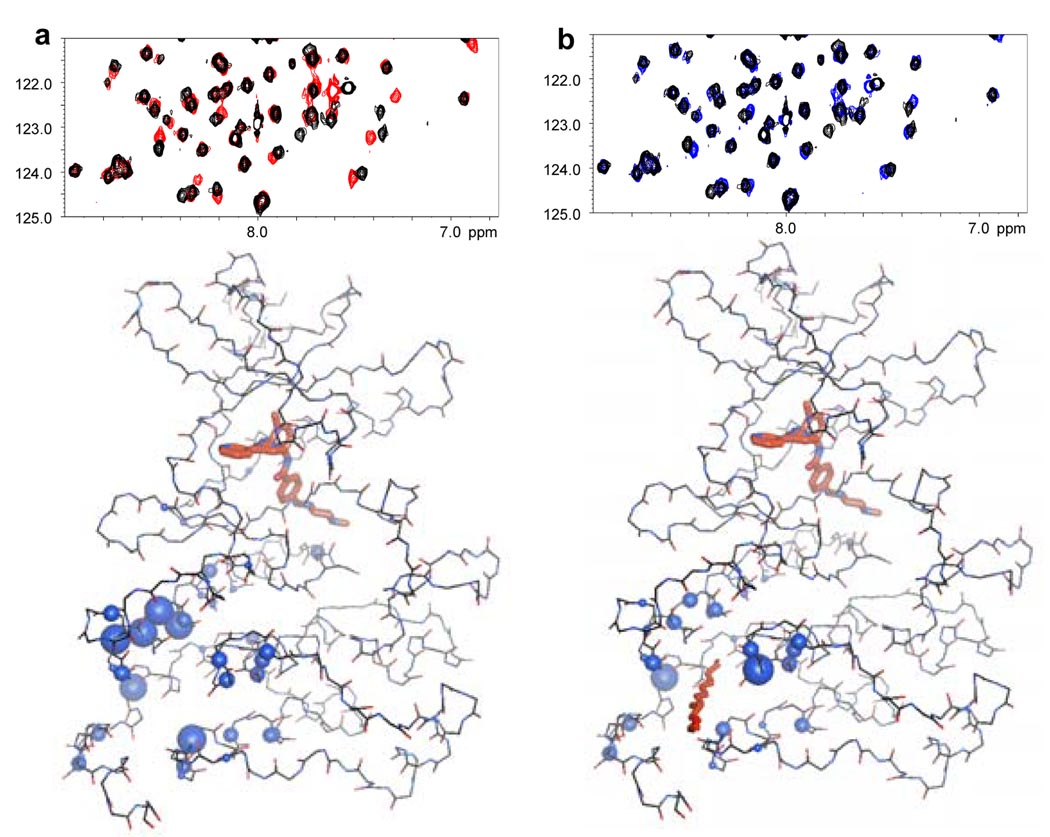
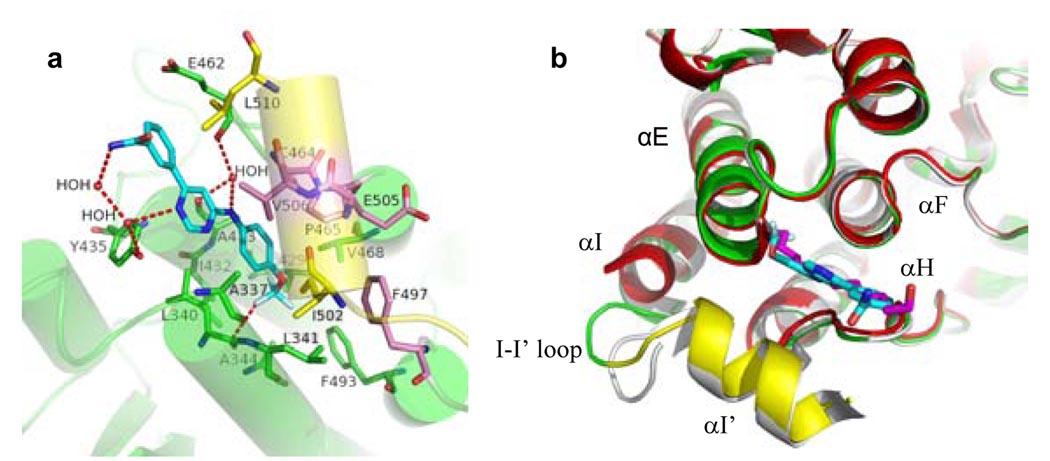
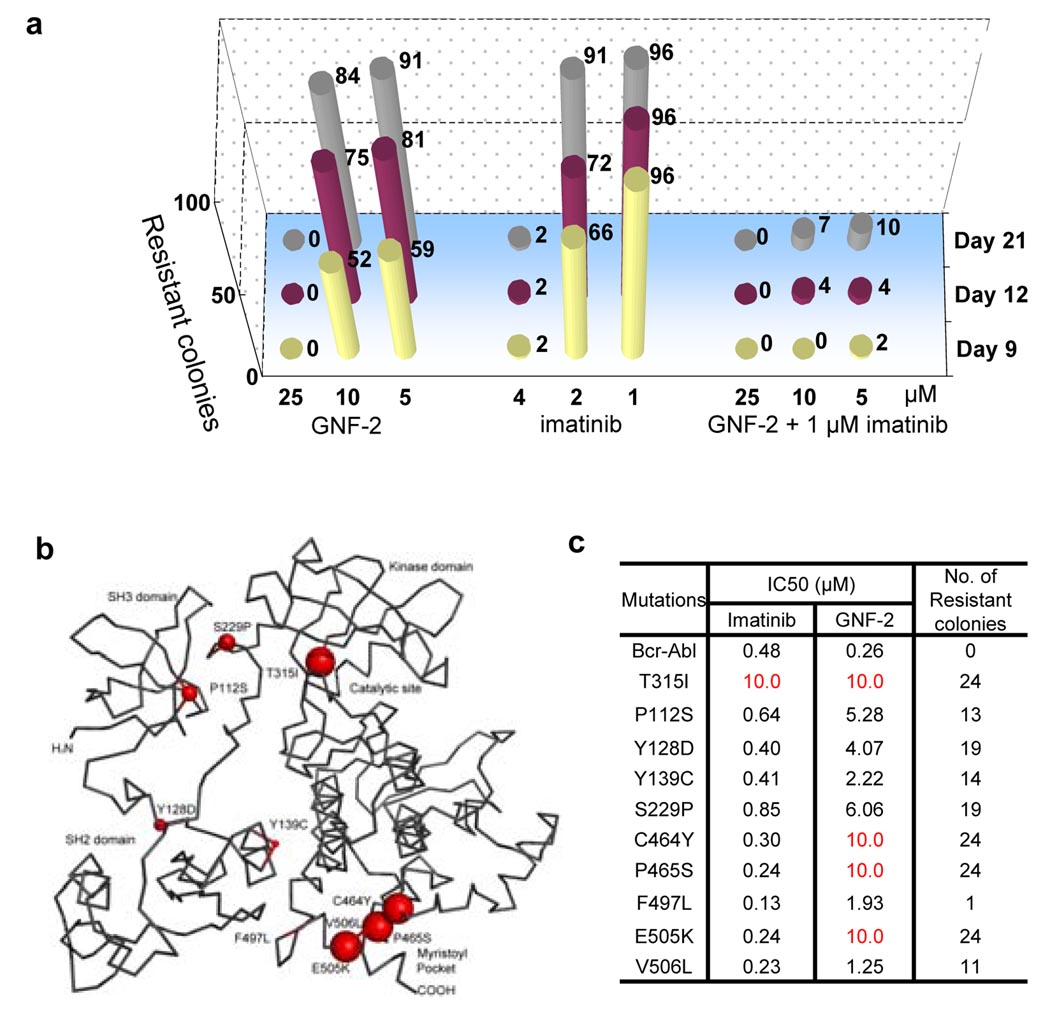
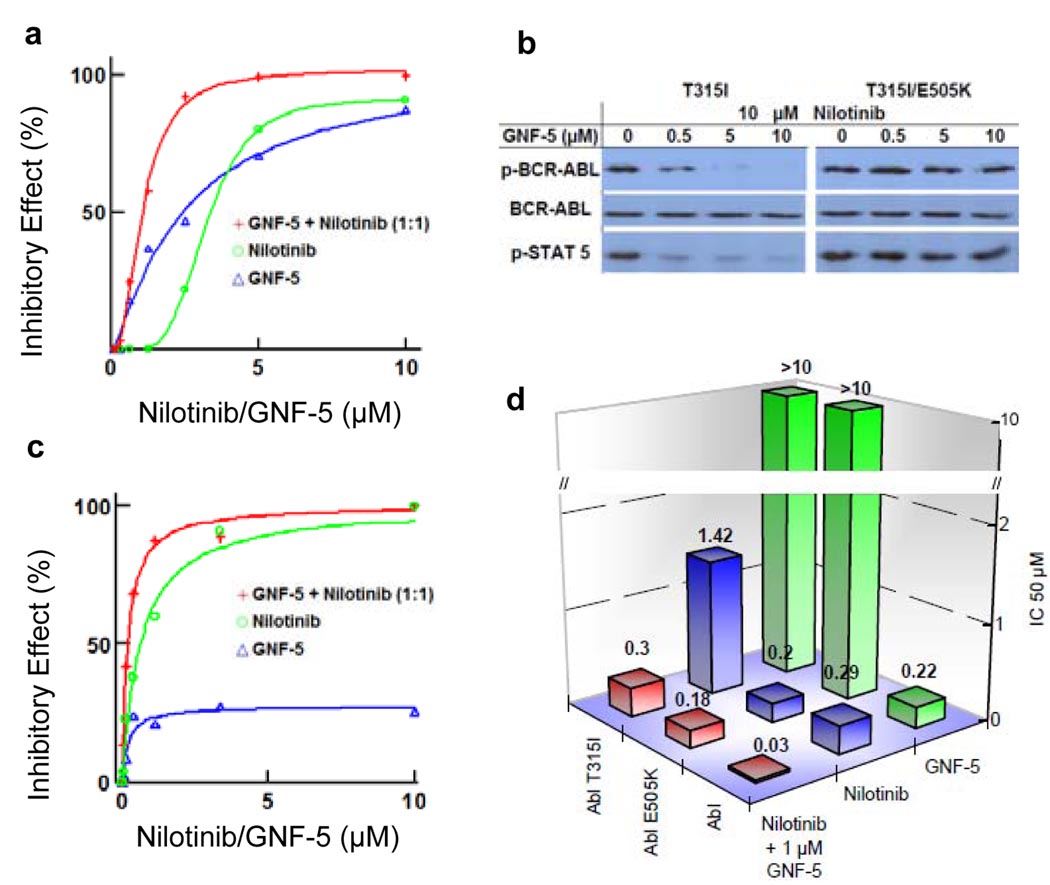
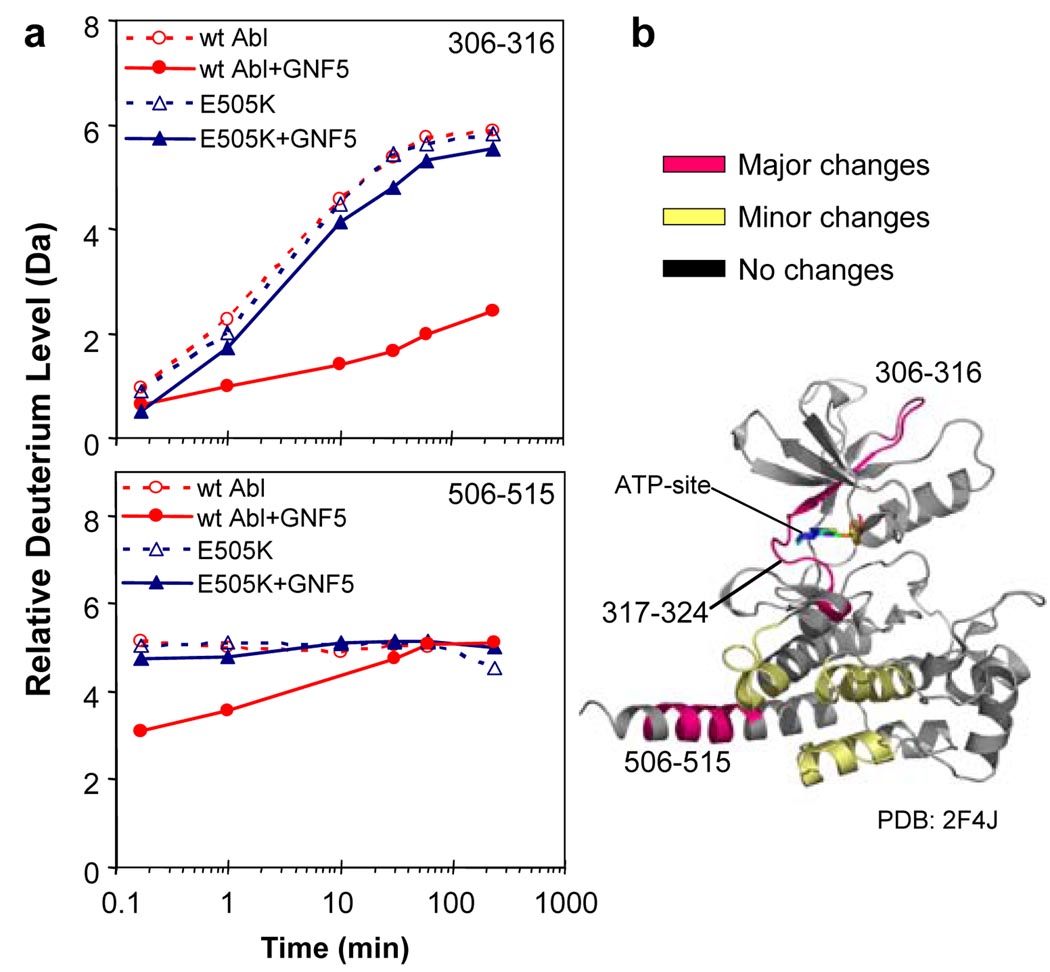
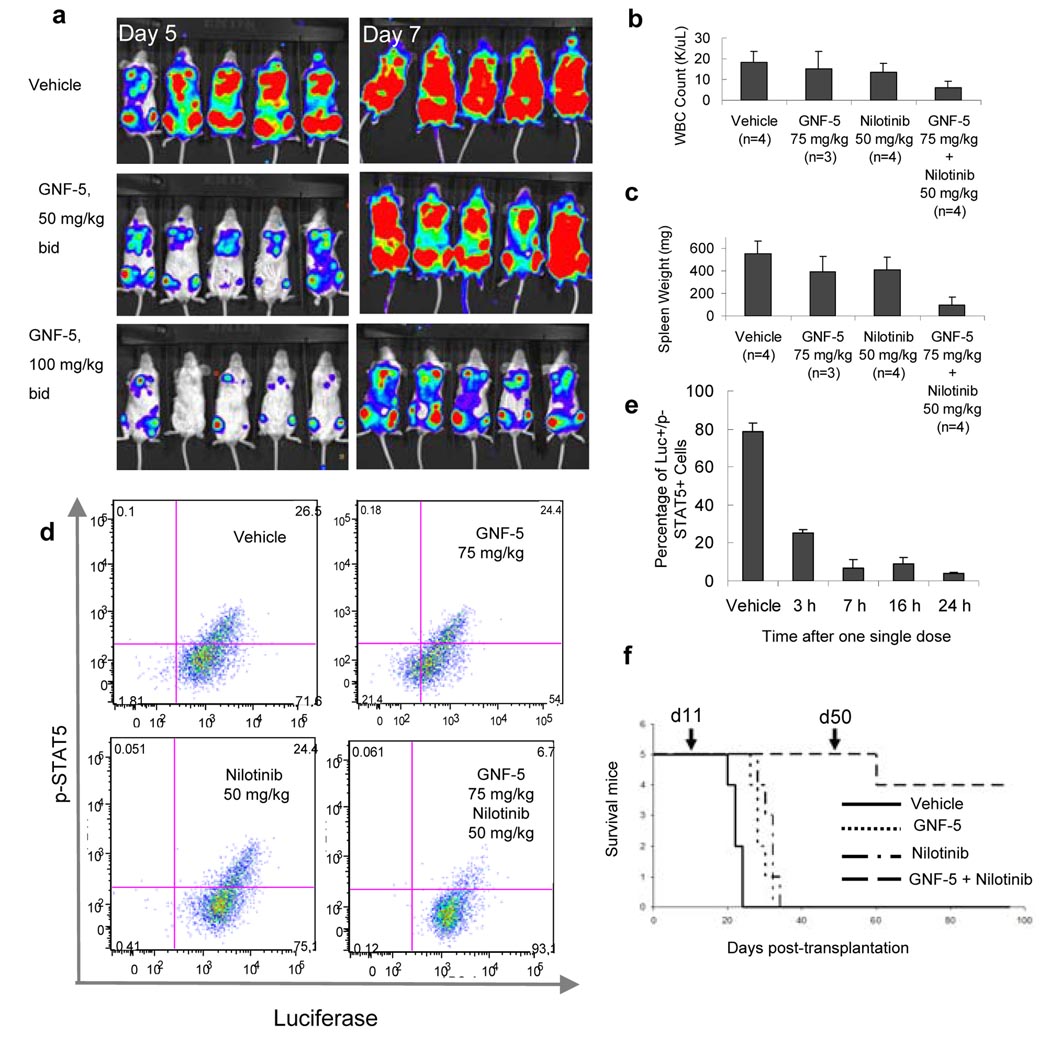
In an effort to find new pharmacological modalities to overcome resistance to ATP-binding-site inhibitors of Bcr-Abl, we recently reported the discovery of GNF-2, a selective allosteric Bcr-Abl inhibitor. Here, using solution NMR, X-ray crystallography, mutagenesis and hydrogen exchange mass spectrometry, we show that GNF-2 binds to the myristate-binding site of Abl, leading to changes in the structural dynamics of the ATP-binding site. GNF-5, an analogue of GNF-2 with improved pharmacokinetic properties, when used in combination with the ATP-competitive inhibitors imatinib or nilotinib, suppressed the emergence of resistance mutations in vitro, displayed additive inhibitory activity in biochemical and cellular assays against T315I mutant human Bcr-Abl and displayed in vivo efficacy against this recalcitrant mutant in a murine bone-marrow transplantation model. These results show that therapeutically relevant inhibition of Bcr-Abl activity can be achieved with inhibitors that bind to the myristate-binding site and that combining allosteric and ATP-competitive inhibitors can overcome resistance to either agent alone.


Figures

Figure 1
Figure 1. NMR spectroscopy provides evidence for GNF-2 binding to the c-terminal myristate pocket of Abl
a, An HSQC spectrum of the Abl/imatinib complex with (red) and without (black) GNF-2 (top) showing chemical shift changes induced by ligand binding. Mapping of the chemical shift changes to the structure of the Abl/imatinib complex (PDB entry 1OPK bottom) identifies the myristate pocket as the GNF-2 binding site. The size of the spheres is proportional to the magnitude of the chemical shift changes. b, Same as a except myristic acid used instead of GNF-2.
Figure 2
Figure 2. Crystal structure of GNF-2 bound to the Abl myristoyl pocket
a, Abl kinase is indicated in green (helices indicated with transparent cylinders) with the bent part of the I-helix in yellow, GNF-2 resistance mutations in pink, and GNF-2 carbons in cyan. H-bonding and other polar interactions are indicated by dotted red lines. b, Superposition of the Abl–imatinib–myr (white), Abl-imatinib-GNF-2 (green and yellow), Abl-imatinib (red) structures. GNF-2 is colored in cyan and myristic acid in magenta.
Figure 3
Figure 3. Location and cellular IC50 of Bcr-Abl GNF-2 resistance mutations
a, Effect of various concentrations of GNF-2, imatinib, or combinations of both on the number of emerging Ba/F3.Bcr-Abl resistant clones (shown on the top of each bar). b, Mutations indicated by red spheres on Abl with size proportional to the degree of resistance (PDB ID 1OPK, amino acid residues numbering of Abl 1a). c, IC50 for growth inhibition by imatinib or GNF-2 for wild-type and mutant Bcr-Abl transformed Ba/F3 cells. The number of colonies that emerge after 12 days in the presence of 20 µM GNF-2 is indicated.
Figure 4
Figure 4. Cellular and enzymatic inhibition of wild-type and mutants by combination treatments
a, Effects of GNF-5, nilotinib and varying concentrations of GNF-5 in combination with nilotinib (0.3–10 µM) on the proliferation of T315I Bcr-Abl Ba/F3 cells. The combination curve (red, as well in Fig 4c) contains twice the total drug concentration of the single agent curves due to both drugs being present. b, Inhibition of Bcr-Abl autophosphorylation was determined by Bcr-Abl immunoprecipitation, followed by a immunoblot for phospho-Tyr (Y412), phospho-STAT5 (Y694) and total Bcr-Abl (antibody K-12) from cell lystates obtained after treatment of T315I Bcr-Abl expressing Ba/F3 with 10 µM of nilotinib and increasing concentrations of GNF-5 (0, 0.5, 5 and 10 µM) for 90 min. c, Percent inhibition of T315I Abl kinase by nilotinib and GNF-5 or the combination. d, IC50 for inhibition of wild-type, E505K and T315I Abl kinase activity by GNF-5, nilotinib or the combination at an ATP concentration of 20 µM.
Figure 5
Figure 5. Hydrogen exchange mass spectrometry upon binding of GNF-5 to Abl
a, Deuterium uptake curves for the peptides 306–316 and 506–515. The y-axis maximum corresponds to the theoretical maximum amount of deuterium that could be incorporated into this peptide. No alterations in deuterium incorporation were seen with the E505K mutant whereas exchange was affected by GNF-5 binding to the wild-type protein. b, Location of the peptides that showed differences in deuterium incorporation mapped on the crystal structure of active Abl (PDB: 2F4J). This crystal structure was chosen because in the absence of myristoylation (as for the protein used here), Abl protein is believed to be in this conformation. Major changes (colored magenta) were defined as a difference between exchange curves of 1.0 Da or more. Minor changes (colored yellow) were 0.4–1.0 Da. No changes (colored grey) were differences of 0.0–0.4 Da.
Figure 6
Figure 6. In vivo efficacy studies with GNF-5 on wild-type and T315I Bcr-Abl dependent proliferation in xenograft and bone marrow transplantation models
a, Images of whole body luminescence of wild-type Bcr-Abl and luciferase expressing Ba/F3 cells on days five and seven after treatment with vehicle, GNF-5 50 mg/kg and 100 mg/kg b.i.d. b, Average white blood cell counts for vehicle, nilotinib, GNF-5, or combination treatments in the T315I Bcr-Abl bone marrow transplantation efficacy study. c, Spleen weight for vehicle, nilotinib, GNF-5, or combination treatments in the T315I Bcr-Abl bone marrow transplantation efficacy study. d, Quantification of p-STAT5-positive cells by flow cytometry in the different treatment groups after repeated doses. e, Time course inhibition of STAT5 phosphorylation after a single dose of GNF-5 and nilotinib combination. f, Kaplan-Meier plot showing survival of mice (n = 5 mice per group) transplanted with T315I Bcr-Abl transduced bone marrow and treated with vehicle (solid line), 75 mg/kg b.i.d. GNF-5 (dotted line), 50 mg/kg b.i.d. nilotinib (dots and dashes), or a combination of 75 mg/kg b.i.d. GNF-5 plus 50 mg/kg b.i.d. nilotinib (dashed line). Compound dosing was initiated on day 11 post-transplantation and discontinued on day 50 (indicated by arrows). Error bars are s.e.m.

Similar articles

Cited by

References

    1. Weisberg E, et al. Characterization of AMN107, a selective inhibitor of native and mutant Bcr-Abl. Cancer Cell. 2005;7(2):129. - PubMed
    1. Quintas-Cardama A, Kantarjian H, Cortes J. Flying under the radar: the new wave of BCR-ABL inhibitors. Nat Rev Drug Discov. 2007;6(10):834. - PubMed
    1. Shah NP, et al. Overriding imatinib resistance with a novel ABL kinase inhibitor. Science. 2004;305(5682):399. - PubMed
    1. Gorre ME, et al. Clinical resistance to STI-571 cancer therapy caused by BCR-ABL gene mutation or amplification. Science. 2001;293(5531):876. - PubMed
    1. Nagar B, et al. Crystal structures of the kinase domain of c-Abl in complex with the small molecule inhibitors PD173955 and imatinib (STI-571) Cancer Res. 2002;62(15):4236. - PubMed

Publication types

MeSH terms

Associated data