. 2010 Feb;16(2):205-13.
doi: 10.1038/nm.2091. Epub 2010 Jan 13.

Effective and selective targeting of leukemia cells using a TORC1/2 kinase inhibitor

Affiliations

Effective and selective targeting of leukemia cells using a TORC1/2 kinase inhibitor

Matthew R Janes et al. Nat Med. 2010 Feb.

Abstract

Targeting the mammalian target of rapamycin (mTOR) protein is a promising strategy for cancer therapy. The mTOR kinase functions in two complexes, TORC1 (target of rapamycin complex-1) and TORC2 (target of rapamycin complex-2); however, neither of these complexes is fully inhibited by the allosteric inhibitor rapamycin or its analogs. We compared rapamycin with PP242, an inhibitor of the active site of mTOR in both TORC1 and TORC2 (hereafter referred to as TORC1/2), in models of acute leukemia harboring the Philadelphia chromosome (Ph) translocation. We demonstrate that PP242, but not rapamycin, causes death of mouse and human leukemia cells. In vivo, PP242 delays leukemia onset and augments the effects of the current front-line tyrosine kinase inhibitors more effectively than does rapamycin. Unexpectedly, PP242 has much weaker effects than rapamycin on the proliferation and function of normal lymphocytes. PI-103, a less selective TORC1/2 inhibitor that also targets phosphoinositide 3-kinase (PI3K), is more immunosuppressive than PP242. These findings establish that Ph(+) transformed cells are more sensitive than normal lymphocytes to selective TORC1/2 inhibitors and support the development of such inhibitors for leukemia therapy.


Conflict of interest statement

Competing Interests: MBM, PR, YL and CR are employees of Intellikine, a company developing mTOR inhibitors for therapeutic use. DAF is a member of the Scientific Advisory Board of Intellikine.

Figures

Figure 1
Figure 1
PP242 induces apoptosis of p190 BCR-ABL-transformed mouse hematopoietic progenitors and human Ph+ B-ALL cells in vitro. (a) Schematic model of BCR-ABL driven mechanisms of oncogenic survival (top) and models of incomplete mTOR inhibition (bottom, left) versus complete and selective mTOR inhibition (bottom, middle) versus nonselective PI3K/mTOR inhibition (bottom, right) in Ph+ disease. Green = activated; red = inhibited. Selective mTOR inhibitors (middle) may affect PI3K (purple) differently depending on the degree of off-target inhibition. (b) The number of viable mouse p190, human SUP-B15, or human K562 cells following treatment (48 hr) with the indicated inhibitors was determined by the MTS assay (n = 3–9 independent experiments, error bars omitted for clarity). (c) p190 cells were cultured for 24 hr with the inhibitors indicated, then DNA content was measured by flow cytometry. (d–f) Anti-clonogenic effects of PP242 combined with DA in primary Ph+ leukemias. Purified bone marrow (BM) or peripheral blood (PB) from untreated, newly diagnosed individuals with Ph+ B-ALL (n = 8) (d), relapsed or refractory Ph+ B-ALL (n = 6) (e), and imatinib-resistant BC-CML (n = 4 LyBC-CML and n = 1 MyBC-CML) (f), were assessed for colony formation potential in MethoCult cultures with dasatinib (DA; 5 nM) alone or in combination with increasing concentrations (20 or 200 nM) of rapamycin (RAP), PP242, or BEZ235 (*P < 0.05, **P < 0.01, #P < 0.001, RM-ANOVA, measured vs. control except where indicated by brackets). See also Supplementary Table 4 for details of clinical subjects.
Figure 2
Figure 2
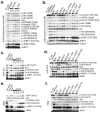
PP242 completely inhibits TORC1 and TORC2 signaling in BCR-ABL+ cells whereas rapamycin partially suppresses TORC1 and drives a PI3K/AKT surge. (a–b) Western blots of p190 cells treated for 1.5 hr (a) or 3 hr (b) with indicated inhibitors. Cells were treated with imatinib (IM; 0.5 and 1.0 μM), DA (5 and 50 nM), PP242 and RAP (50 and 400 nM). Clinically achievable concentrations of IM (1.0 μM) and DA (100 nM) were used for the combination treatments. (c–d) Western blots of SUP-B15 or (e–f) K562 cells treated for 3 hr with indicated inhibitors.
Figure 3
Figure 3
Immunofluorescence analysis shows that PP242 induces Foxo1 nuclear entry without affecting PIP3 levels. (a) Activation of PI3K was quantified in cells by signal pixel intensity and localized area of PIP3 accumulation by confocal microscopy (*P < 0.05, #P < 0.001, ANOVA). Cells were cultured for 4 hr with PI-103 (2 μM), the PI3K inhibitor IC87114 (10 μM), PP242 (20 and 200 nM), or RAP (20 and 200 nM). A minimum of 250 cells was quantified from 2 separate images. Representative images depict PIP3 accumulation, nuclear content (DAPI stain) merged onto DIC images (13.5 μm scale bar). (b) p190 cells were cultured for 8 hr in chamber wells with DA (10 nM), PP242 (250 nM), BEZ-235 (250 nM), RAP (250 nM), and pulsed with EdU 1 hr prior to fixation. Loss of proliferation (EdU accumulation), and distinct localization patterns of Foxo1 were assessed by confocal microscopy (22.5 μm scale bar) and representative cells were magnified for clarity (10 μm scale bar). Hoechst is a nuclear stain. (c) Cells were treated with the Mek inhibitor PD90853 (10,000 nM), LY294002 (1,000 nM), and -indicated concentrations of RAP and PP242 for 24 hr. Lysates were analyzed by western blotting. An increase in LC3-II is characteristic of increased autophagy.
Figure 4
Figure 4
PP242 selectively suppresses leukemic expansion in vivo and extends survival. (a–d) Short-term anti-leukemic efficacy of PP242 in conditioned recipients (450 rad) engrafted with mouse p190 cells. (a) Schematic of treatment design where mice injected i.v. with p190 cells (n = 3) were treated twice daily (p.o., b.i.d.) starting on day 7 for 4 days, with PP242 or vehicle (PEG400). (b) Leukemic burden (mean % ± s.d., ANOVA) was assessed by flow cytometry. (c) Leukemic cells actively cycling (EdU+) was measured by flow cytometry (mean ± s.d., ANOVA). (d) The pharmacodynamic activity of PP242 was assessed using intracellular phospho-staining of leukemic (hCD4+B220+) cells from the bone marrow of recipient mice. (e) Short-term treatment study comparing p190 leukemia burden as in (a), but comparing combinations of IM (150 mg kg−1 i.p., qd) with RAP (7 mg kg−1 i.p., qd), PP242 (60 mg kg−1 p.o., qd), or different doses of PI-103 (i.p., b.i.d.). Graphs show leukemic burden in the bone marrow (left), or percent cycling cells among leukemic hCD4+ (middle) or host hCD4 bone marrow (right). (f) Mice injected with p190 cells were treated daily (qd) starting on day 7 post-transplant with IM (150 mg kg−1, i.p.), RAP (7 mg kg−1, i.p.) and PP242 (30 and 60 mg kg−1, p.o.). Mice were followed daily for survival (n = 5 per group, median ± interquartile range).
Figure 5
Figure 5
PP242 enhances efficacy of dasatinib and the combination causes regression of human Ph+ B-ALL xenografts. (a) SUP-B15ffLuc cells were injected into NSG mice and leukemia development was monitored by sequential bioluminescent imaging. The scale on the right shows the color scheme for low (red) to high (yellow) photon flux. Both ventral (V) and dorsal (D) images were taken, allowing detection of luminescent cells in the brain and spinal cord. Representative images are shown. The graph on the left shows the bioluminescence (photon flux) detected in each treatment group (mean ± s.d., RM-ANOVA). Vehicle (n = 4), DA (2.5 mg kg−1, n = 5), or DA combined with PP242 (60 mg kg−1, n = 5) or combined with RAP (7.5 mg kg−1). (b) Schematic of treatment design for xenografts of primary human Ph+ B-ALL. NSG mice were treated five days per week (samples MD1, MD3, MD4 for 1 week; MD11 for 2 weeks; and MD3 for 3 weeks) with DA, DA combined with PP242, or vehicle. (c–h) Leukemic burden (mean ± s.d., ANOVA) and cycling cells (mean ± s.d., two-way ANOVA) were assessed by flow cytometry. (c) shows representative cycling ability (EdU+) of normal marrow (red gate) and leukemic (blue gate) populations. Arrow signifies selective regression of leukemia. The total leukemic burden (panels d–h) was determined from %hCD45 or hCD19 in the BM. *P < 0.05, **P < 0.01, #P < 0.001.
Figure 6
Figure 6
In vitro and in vivo selectivity of PP242 compared to rapamycin. (a) Hematopoietic clonogenic progenitors of bone marrow cells from a healthy human donor were assessed for colony formation in the presence of indicated concentrations of inhibitors. (b–d) Cell division tracking of mouse lymphocytes was done by labeling cells with CFSE before incubation for 3 d with the indicated stimuli. Reduced CFSE fluorescence denotes cell division. The histogram overlays (b–c) show cell division history of CFSE-labeled B cells pretreated with RAP, PP242, PI-103 or Ku-0063794 (15 min) before stimulation with anti-IgM (b) or LPS (c). Dot plots (d) depict CFSE fluorescence versus cell size (forward scatter) of activated T cells pretreated with RAP, PP242 or BEZ-235. Shown are representative examples of 3–5 independent experiments. In (b–c), upper and lower histograms are from same experiment. (e–g) Groups of 3–4 mice were immunized with NP-OVA in alum (i.p.) and immune responses measured 8 days later. Mice were treated with vehicle, RAP (7.5 mg kg−1, i.p., qd), PP242 (60 mg kg−1, p.o., qd), or PI-103 (10, 30 or 60 mg kg−1, i.p., b.i.d.) starting one day before immunization. S = sham immunized. (e) NP-specific IgM in serum were quantified by ELISA (mean ± s.d.); equivalent results were obtained for NP-specific IgG1 (data not shown). (f) Splenic GCB cells (CD38lowFas+, gated on B220+IgD) and (g) total B cells and T cell subsets were quantified (mean ± s.d.) by flow cytometry.

Similar articles

Cited by

References

    1. Engelman JA, Luo J, Cantley LC. The evolution of phosphatidylinositol 3-kinases as regulators of growth and metabolism. Nat Rev Genet. 2006;7:606–619. - PubMed
    1. Manning BD, Cantley LC. AKT/PKB signaling: navigating downstream. Cell. 2007;129:1261–1274. - PMC - PubMed
    1. Samuels Y, Ericson K. Oncogenic PI3K and its role in cancer. Curr Opin Oncol. 2006;18:77–82. - PubMed
    1. Martelli AM, et al. Involvement of the phosphoinositide 3-kinase/Akt signaling pathway in the resistance to therapeutic treatments of human leukemias. Histol Histopathol. 2005;20:239–252. - PubMed
    1. Wee S, et al. PI3K pathway activation mediates resistance to MEK inhibitors in KRAS mutant cancers. Cancer Res. 2009;69:4286–4293. - PubMed

Publication types