

Gene expression profiles deciphering rice phenotypic variation between Nipponbare (Japonica) and 93-11 (Indica) during oxidative stress
- PMID: 20072620
- PMCID: PMC2799674
- DOI: 10.1371/journal.pone.0008632
Gene expression profiles deciphering rice phenotypic variation between Nipponbare (Japonica) and 93-11 (Indica) during oxidative stress
Abstract
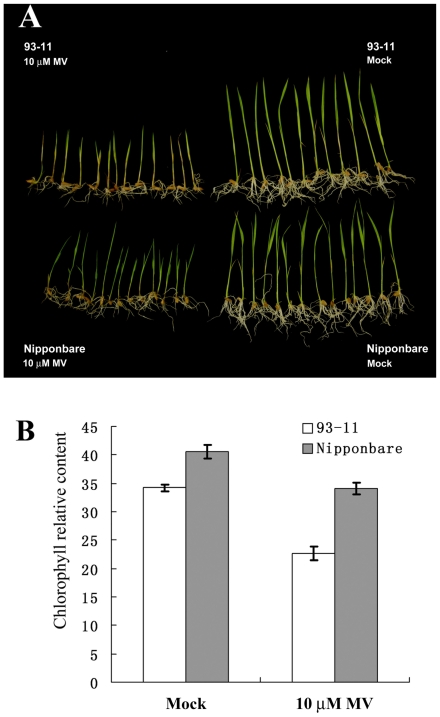
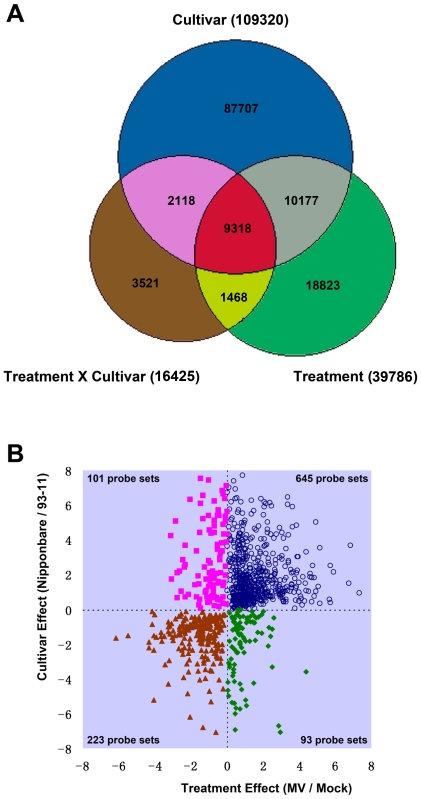
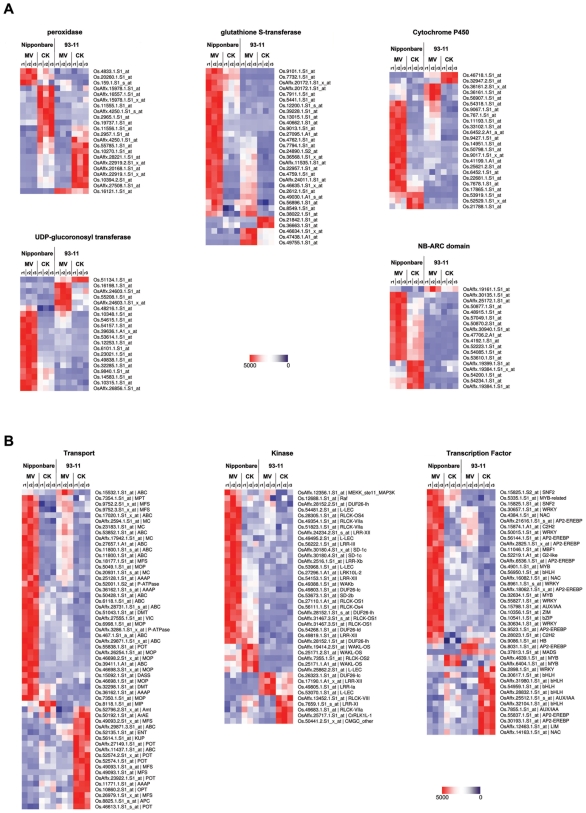
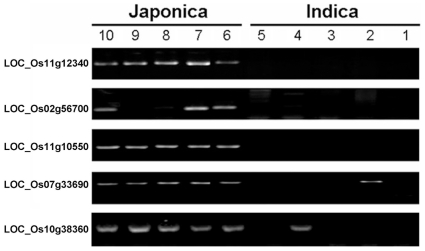
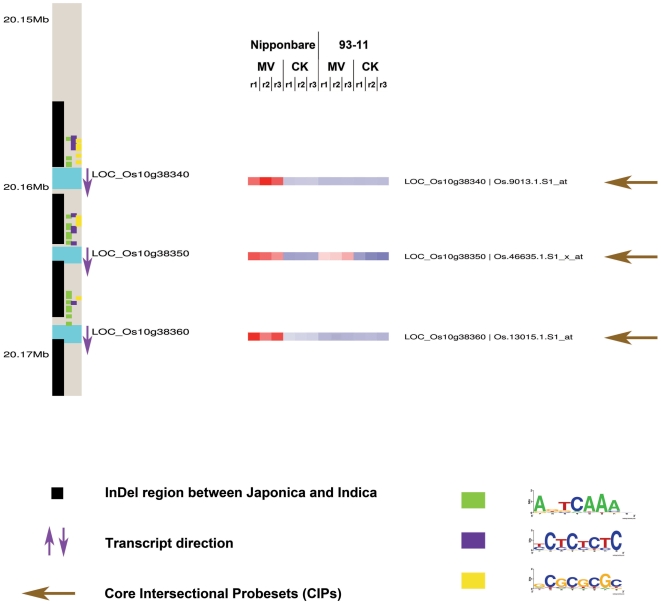
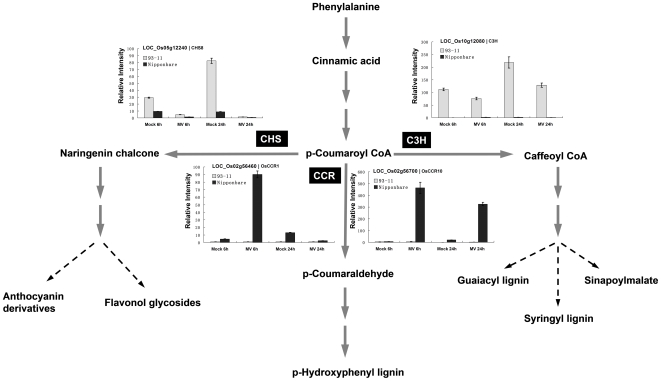
Rice is a very important food staple that feeds more than half the world's population. Two major Asian cultivated rice (Oryza sativa L.) subspecies, japonica and indica, show significant phenotypic variation in their stress responses. However, the molecular mechanisms underlying this phenotypic variation are still largely unknown. A common link among different stresses is that they produce an oxidative burst and result in an increase of reactive oxygen species (ROS). In this study, methyl viologen (MV) as a ROS agent was applied to investigate the rice oxidative stress response. We observed that 93-11 (indica) seedlings exhibited leaf senescence with severe lesions under MV treatment compared to Nipponbare (japonica). Whole-genome microarray experiments were conducted, and 1,062 probe sets were identified with gene expression level polymorphisms between the two rice cultivars in addition to differential expression under MV treatment, which were assigned as Core Intersectional Probesets (CIPs). These CIPs were analyzed by gene ontology (GO) and highlighted with enrichment GO terms related to toxin and oxidative stress responses as well as other responses. These GO term-enriched genes of the CIPs include glutathine S-transferases (GSTs), P450, plant defense genes, and secondary metabolism related genes such as chalcone synthase (CHS). Further insertion/deletion (InDel) and regulatory element analyses for these identified CIPs suggested that there may be some eQTL hotspots related to oxidative stress in the rice genome, such as GST genes encoded on chromosome 10. In addition, we identified a group of marker genes individuating the japonica and indica subspecies. In summary, we developed a new strategy combining biological experiments and data mining to study the possible molecular mechanism of phenotypic variation during oxidative stress between Nipponbare and 93-11. This study will aid in the analysis of the molecular basis of quantitative traits.
Conflict of interest statement
Figures
Similar articles
-
A collection of 10,096 indica rice full-length cDNAs reveals highly expressed sequence divergence between Oryza sativa indica and japonica subspecies.Plant Mol Biol. 2007 Nov;65(4):403-15. doi: 10.1007/s11103-007-9174-7. Epub 2007 May 24. Plant Mol Biol. 2007. PMID: 17522955
-
Differential alternative polyadenylation contributes to the developmental divergence between two rice subspecies, japonica and indica.Plant J. 2019 Apr;98(2):260-276. doi: 10.1111/tpj.14209. Epub 2019 Feb 13. Plant J. 2019. PMID: 30570805
-
Global Transcriptome and Co-Expression Network Analysis Reveal Contrasting Response of Japonica and Indica Rice Cultivar to γ Radiation.Int J Mol Sci. 2019 Sep 5;20(18):4358. doi: 10.3390/ijms20184358. Int J Mol Sci. 2019. PMID: 31491955 Free PMC article.
-
Role of defense/stress-related marker genes, proteins and secondary metabolites in defining rice self-defense mechanisms.Plant Physiol Biochem. 2006 May-Jun;44(5-6):261-73. doi: 10.1016/j.plaphy.2006.06.010. Epub 2006 Jun 16. Plant Physiol Biochem. 2006. PMID: 16806959 Review.
-
Genetic dissection of agronomically important traits in closely related temperate japonica rice cultivars.Breed Sci. 2017 Dec;67(5):427-434. doi: 10.1270/jsbbs.17053. Epub 2017 Nov 15. Breed Sci. 2017. PMID: 29398936 Free PMC article. Review.
Cited by
-
The role of ROS signaling in cross-tolerance: from model to crop.Front Plant Sci. 2014 Dec 23;5:754. doi: 10.3389/fpls.2014.00754. eCollection 2014. Front Plant Sci. 2014. PMID: 25566313 Free PMC article. Review.
-
Comparative transcriptome profiling of chilling stress responsiveness in two contrasting rice genotypes.PLoS One. 2012;7(8):e43274. doi: 10.1371/journal.pone.0043274. Epub 2012 Aug 17. PLoS One. 2012. PMID: 22912843 Free PMC article.
-
Modulation of transcription factor and metabolic pathway genes in response to water-deficit stress in rice.Funct Integr Genomics. 2011 Mar;11(1):157-78. doi: 10.1007/s10142-010-0187-y. Epub 2010 Sep 7. Funct Integr Genomics. 2011. PMID: 20821243
-
Differential gene expression profile in Pseudomonas putida NBRIC19-treated wheat (Triticum aestivum) plants subjected to biotic stress of Parthenium hysterophorus.Mol Biol Rep. 2014 Mar;41(3):1385-99. doi: 10.1007/s11033-013-2983-7. Epub 2014 Jan 10. Mol Biol Rep. 2014. PMID: 24407601
-
Metabolic variation between japonica and indica rice cultivars as revealed by non-targeted metabolomics.Sci Rep. 2014 May 27;4:5067. doi: 10.1038/srep05067. Sci Rep. 2014. PMID: 24861081 Free PMC article.
References
-
- Cheng KS. A statistical evaluation of the classification of rice cultivars into hsien and keng subspecies. RGN. 1985;2:46–48.
-
- Kato S, Kosaka H, Hara S. On the affinity of rice varieties as shown by fertility of hybrid plants. Bull Sci Fac Agric, Kyushu Univ, Fukuoka, Japan. 1928;3:132–147.
-
- Morishima H, Oka HI. Phylogenetic differentiation of cultivated rice, 22. Numerical evaluation of the Indica-Japonica differentiation. Jpn J Breed. 1981;31:402–413.
-
- Vitte C, Ishii T, Lamy F, Brar D, Panaud O. Genomic paleontology provides evidence for two distinct origins of Asian rice (Oryza sativa L.). Mol Genet Genomics. 2004;272:504–511. - PubMed
Publication types
MeSH terms
Substances
LinkOut - more resources
Full Text Sources
Research Materials
