. 2008 Dec;1(2-4):59-72.
doi: 10.1007/s12177-008-9009-z. Epub 2008 Jul 11.

Comparison of gene expression during in vivo and in vitro postnatal retina development

Comparison of gene expression during in vivo and in vitro postnatal retina development

Mu-Gen Liu et al. J Ocul Biol Dis Infor. 2008 Dec.

Abstract

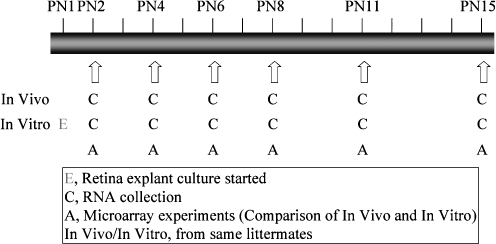
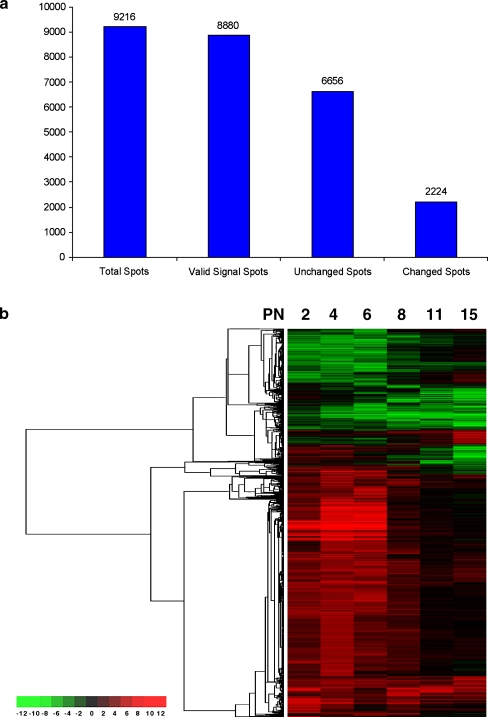
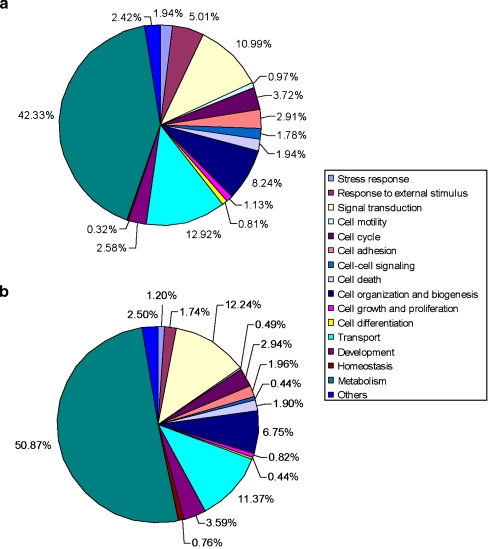
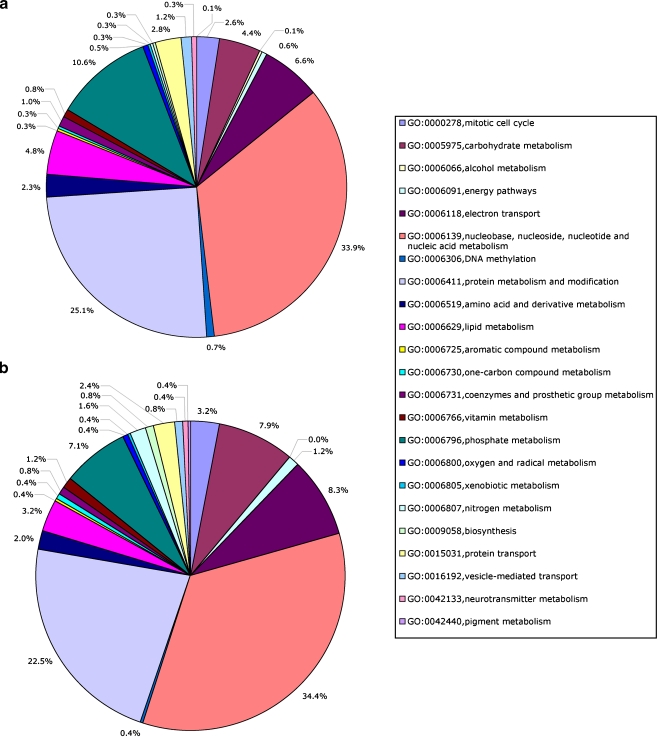
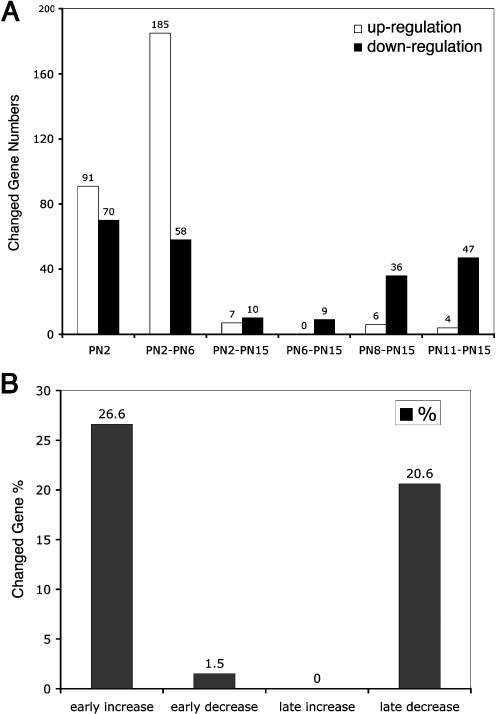
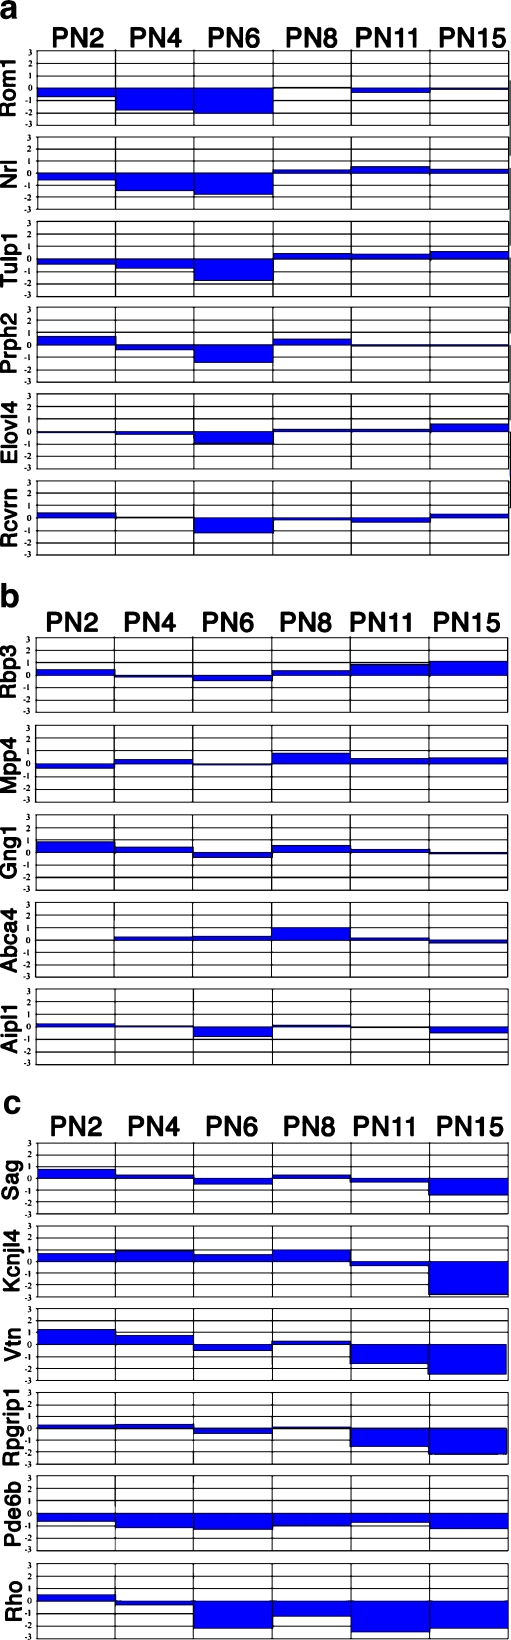
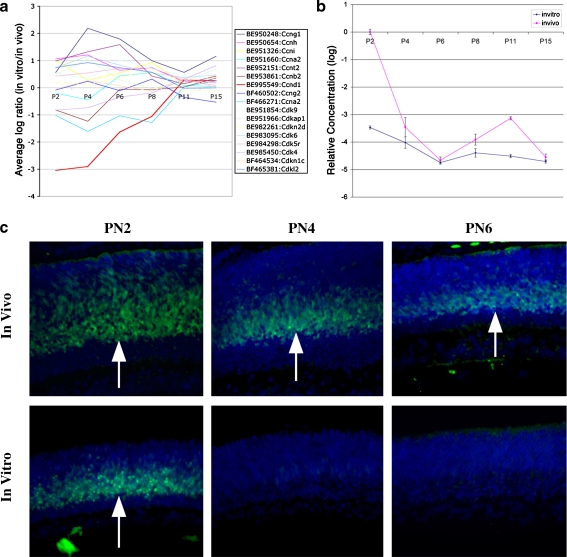
Retina explants are widely used as a model of neural development. To define the molecular basis of differences between the development of retina in vivo and in vitro during the early postnatal period, we carried out a series of microarray comparisons using mouse retinas. About 75% of 8,880 expressed genes from retina explants kept the same expression volume and pattern as the retina in vivo. Fewer than 6% of the total gene population was changed at two consecutive time points, and only about 1% genes showed more than a threefold change at any time point studied. Functional Gene Ontology (GO) mapping for both changed and unchanged genes showed similar distribution patterns, except that more genes were changed in the GO clusters of response to stimuli and carbohydrate metabolism. Three distinct expression patterns of genes preferentially expressed in rod photoreceptors were observed in the retina explants. Some genes showed a lag in increased expression, some showed no change, and some continued to have a reduced level of expression. An early downregulation of cyclin D1 in the explanted retina might explain the reduction in numbers of precursors in explanted retina and suggests that external factors are required for maintenance of cyclin D1. The global view of gene profiles presented in this study will help define the molecular changes in retina explants over time and will provide criteria to define future changes that improve this model system.

Electronic supplementary material: The online version of this article (doi:10.1007/s12177-008-9009-z) contains supplementary material, which is available to authorized users.

Keywords: Cyclin D1; Functional genomics; Gene expression; Microarray; Retina development; Retina explant; Rod photoreceptors; System biology.


Figures

Fig. 1
Fig. 1
Strategy of the microarray experiments. The experiment studied six time points during postnatal development. One litter was used for each time point. Whole retinas (n ≥ 8) from half pups of the litter were collected at PN1 and cultured in serum-free medium, while the pups of the other half of the litter developed in vivo. When they reached the desired age, total RNA was isolated, respectively, from whole retina of the in vivo and in vitro groups
Fig. 2
Fig. 2
Overview of retinal gene expression in vitro and in vivo. a Numbers of changed and unchanged genes. The cDNA microarray used in this experiments contains 9,216 spots. 8,880 of them were valid signal spots (the spots which have the fluorescence intensity greater than 300 in any channel at any time point). 6,656 of 8,880 remained unchanged. 2,224 genes gained the mean ratio (in vitro vs in vivo) from two datasets greater than twofold (expression increased in in vitro at least twofold) and the ratio from each dataset greater than 1.5 or mean ratio less than 0.5 fold (expression decreased in in vitro at least twofold) and the ratio from each dataset less than 0.67. b Cluster analysis of the changed genes in all time points. Each numerical intensity ratio of in vitro/in vivo was assigned to a color on a scale from red to green, where red represents higher expression in vitro and green represents lower expression in vitro. There were about 25% genes changed. The first three time points contributed most of the changed genes. Many of them converged to a normal expression level later on. There was also a cluster of genes in the in vitro group, which started with a normal level but then decreased over time compared with in vivo. Many late development stage expression genes were in this group
Fig. 3
Fig. 3
GO comparison between changed and unchanged gene groups. GO comparisons in all genes between changed (a) and unchanged (b) gene groups: The GO functional subgroups of the annotated genes were very similar between changed and unchanged gene groups, except the response to external stimulus and cell–cell signaling groups
Fig. 4
Fig. 4
GO comparison in metabolism subgroups between changed (a) and unchanged (b) gene groups. The GO subgroups of metabolism were very similar between changed and unchanged gene groups, except carbohydrate metabolism, phosphate metabolism, and neurotransmitter metabolism
Fig. 5
Fig. 5
Temporal patterns of increased or decreased gene expression during in vivo and in vitro development. The peak numbers of changed genes occurred at early time points. Upregulated genes were more frequent than the downregulated genes at the early time points, and downregulated genes more frequent at the late time points. Only a few genes changed throughout the observed time window
Fig. 6
Fig. 6
RT-PCR detection of Bnip3 gene expression during in vivo and in vitro retina development. The expression level of Bnip3 at PN2 in vivo was set to a value of 1. At all time points, a higher level of Bnip3 was expressed in vitro compared with in vivo. From PN2 through PN11, this difference was highly significant, p ≤ 0.01, and, though less, remained significant at PN15, p < 0.05
Fig. 7
Fig. 7
Changing pattern of expression in late expressed genes. a Overview of 78 late expressed genes which at early time points showed more increases while at later time points showed more decreases. b Two-channel (in vitro and in vivo) log2 intensity of Rhodopsin (Rho) gene (BE950188) in microarray, normalized by slide median intensity. PN2 in vivo intensity normalized was set as 1. The result showed both late expression pattern of Rhodopsin and the reduced expression level in vitro at the late time points. c Quantitative RT-PCR result of Rho, confirming the late expression pattern of Rho. PN2 in vivo expression level was set as 1. Rho showed reduced expression levels at late time points (p < 0.001 at PN11 and PN15), though it kept the same late increased expression pattern. d Two-channel (in vitro vs in vivo) log2 intensity of Nrl gene (BF464350) in microarray, normalized by slide median intensity. PN2 in vivo intensity normalized was set as 1. The results showed both late expression patterns of Nrl and the reduced expression level in vitro especially at the early time points. e Quantitative RT-PCR result of Nrl, confirming the increasing expression pattern of Nrl. PN2 in vivo expression level was set as 1. Nrl showed reduced expression levels in early time points (p < 0.01 at PN4 and PN6), though it kept the same late increased expression pattern
Fig. 8
Fig. 8
Alternative expression (log ratio of in vitro/in vivo) of preferentially expressed genes in rod photoreceptors in vitro and in vivo. Group I (a) includes Rom1, Nrl, Tulp1, Prph2, Elovl4, and Rcvrn and shows decreased expression levels in the early stages in culture but reaches the same levels as in vivo at later stage; group II (b) includes Rbp3, Mpp4, Gng1, Abca4, and Aipl1 and shows no significant changes during in vitro development; group III (c) includes Sag, Kcnj14, Vtn, Rpgrip1, Pde6b, and Rho and shows decreasing expression levels from the early to later stages or reduced levels in the later stages in vitro
Fig. 9
Fig. 9
Early reduction in cell cycle-related gene Ccnd1. a Cyclin-related genes: All cyclins, cyclin-dependent kinases, and cyclin-dependent kinase inhibitors tested in the microarray are listed in the chart. Expression changes were greatest at the early time points. A few genes underwent significant expression changes including Ccnd1, which was remarkably downregulated in early time points. b Quantitative RT-PCR confirmation of changes in Ccnd1 expression over the postnatal period. The same expression pattern was seen in both in vitro and in vivo with a significant early reduction at PN2 in the in vitro group (p < 0.0000001). c Immunohistochemical staining of early postnatal stages with anti-Ccnd1 antibody showed Ccnd1 (green fluorescence, white arrows) has a higher level at early time points PN2 and PN4 and then a significant reduction at PN6. The reduction in labeling occurred more rapidly in the cultured retinas. Nuclei were labeled by blue fluorescence

Similar articles

Cited by

References

    1. Zhang SS, Fu XY, Barnstable CJ. Tissue culture studies of retinal development. Methods. 2002;28:439–447. doi: 10.1016/S1046-2023(02)00263-3. - DOI - PubMed
    1. Sparrow JR, Hicks D, Barnstable CJ. Cell commitment and differentiation in explants of embryonic rat neural retina. Comparison with the developmental potential of dissociated retina. Brain Res Dev Brain Res. 1990;51:69–84. doi: 10.1016/0165-3806(90)90259-2. - DOI - PubMed
    1. Seigel GM. The golden age of retinal cell culture. Mol Vis. 1999;5:4. - PubMed
    1. Caffe AR, Ahuja P, Holmqvist B, Azadi S, Forsell J, Holmqvist I, et al. Mouse retina explants after long-term culture in serum free medium. J Chem Neuroanat. 2001;22:263–273. doi: 10.1016/S0891-0618(01)00140-5. - DOI - PubMed
    1. Zhang SS, Wei J, Qin H, Zhang L, Xie B, Hui P, et al. STAT3-mediated signaling in the determination of rod photoreceptor cell fate in mouse retina. Invest Ophthalmol Vis Sci. 2004;45:2407–2412. doi: 10.1167/iovs.04-0003. - DOI - PubMed