. 2010 Mar;11(1):61-9.
doi: 10.1007/s10969-009-9076-9. Epub 2010 Jan 14.

Protein crystallization analysis on the World Community Grid

Affiliations

Protein crystallization analysis on the World Community Grid

Christian A Cumbaa et al. J Struct Funct Genomics. 2010 Mar.

Abstract

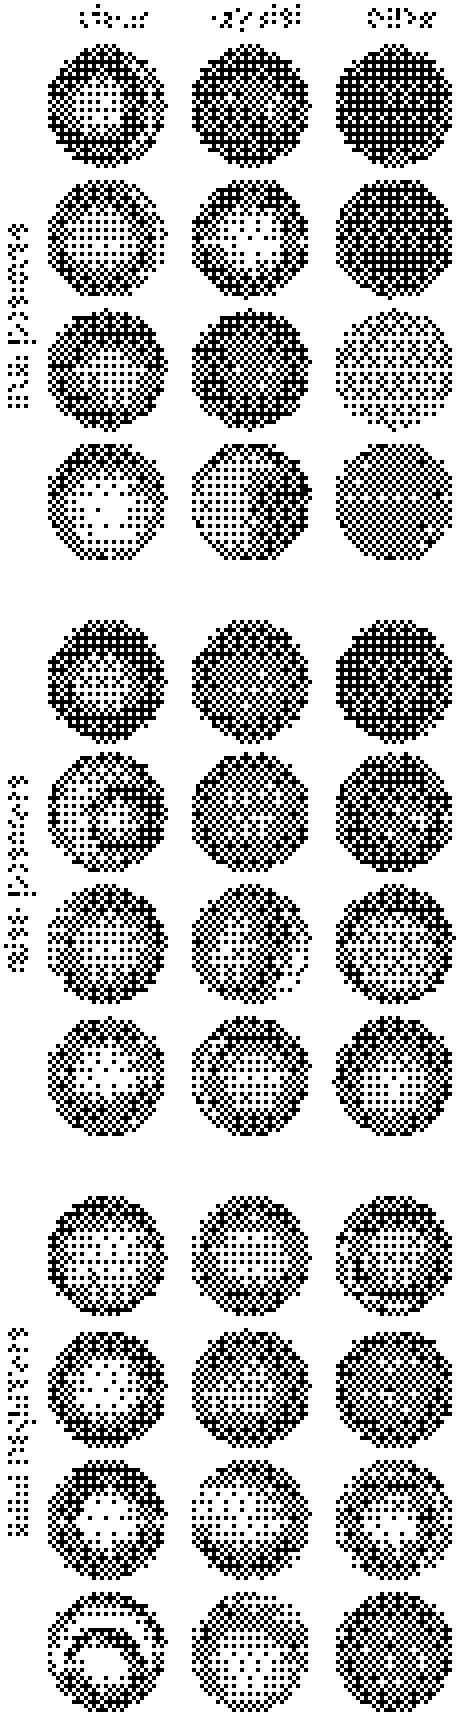
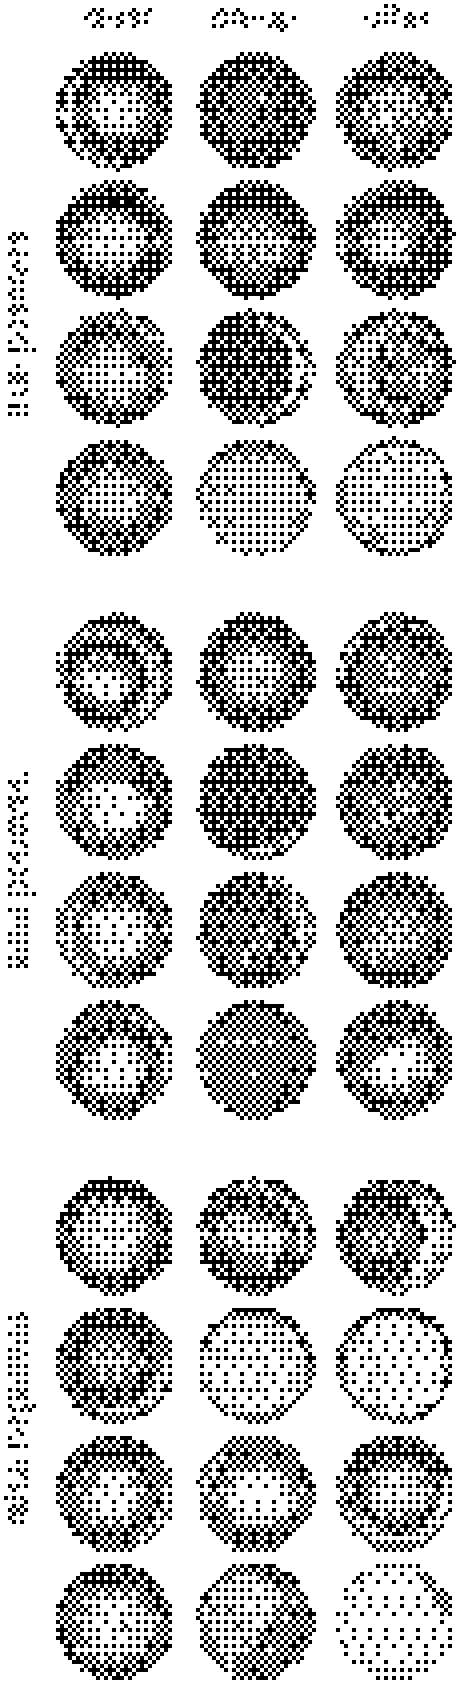
We have developed an image-analysis and classification system for automatically scoring images from high-throughput protein crystallization trials. Image analysis for this system is performed by the Help Conquer Cancer (HCC) project on the World Community Grid. HCC calculates 12,375 distinct image features on microbatch-under-oil images from the Hauptman-Woodward Medical Research Institute's High-Throughput Screening Laboratory. Using HCC-computed image features and a massive training set of 165,351 hand-scored images, we have trained multiple Random Forest classifiers that accurately recognize multiple crystallization outcomes, including crystals, clear drops, precipitate, and others. The system successfully recognizes 80% of crystal-bearing images, 89% of precipitate images, and 98% of clear drops.


Figures

Fig. 1
Fig. 1
Importance measures of the 14,908 features measured during the feature-selection phase of the 10-way classifier training. The 10% highest-scoring features were used to train the three classifiers in this study
Fig. 2
Fig. 2
Precision/recall plot of the 10-way classifier. Viewed as a row of vertical bar charts, each chart shows the relative distribution of true classes for a given RF-assigned label. Black bars (by width) show the proportions of false-positives. Viewed as a column of horizontal bar charts, each chart shows the relative distribution of RF-assigned labels for a given true class. Black bars (by height) show the proportions of false-negatives. From either perspective, the red bar in each chart shows the proportion of correct classifications, i.e., precision (width) or recall (height)
Fig. 3
Fig. 3
Precision/recall plot of the clear/crystal/other classifier
Fig. 4
Fig. 4
Precision/recall plot of the clear/precipitate/other classifier
Fig. 5
Fig. 5
Randomly selected true-positive, false-positive, and false-negative images from the clear/has-crystal/other classifier’s validation set
Fig. 6
Fig. 6
Randomly selected true-positive, false-positive, and false-negative images from the clear/precipitate-only/other classifier’s validation set. Note that the other category includes precipitates combined with other outcomes (e.g., precip & crystal)

References

    1. Bern M, Goldberg D, Stevens RC, Kuhn P. Automatic classification of protein crystallization images using a curve-tracking algorithm. J Appl Cryst. 2004;37:279–287. doi: 10.1107/S0021889804001761. - DOI
    1. Breiman L. Random forests. Mach Learn. 2001;45:5–32. doi: 10.1023/A:1010933404324. - DOI
    1. Cumbaa CA, Lauricella A, Fehrman N, Veatch C, Collins R, Luft J, DeTitta G, Jurisica I. Automatic classification of sub-microlitre protein-crystallization trials in 1536-well plates. Acta Crystallogr D. 2002;59:1619–1627. doi: 10.1107/S0907444903015130. - DOI - PubMed
    1. Cumbaa CA, Jurisica I. Automatic classification and pattern discovery in high-throughput protein crystallization trials. J Struct Funct Genomics. 2005;6:195–202. doi: 10.1007/s10969-005-5243-9. - DOI - PubMed
    1. Haralick RM, Shanmugan K, Dinstein I. Textural Features for Image Classification. IEEE Trans Syst Man Cybern. 1973;3:610–621. doi: 10.1109/TSMC.1973.4309314. - DOI

Publication types

LinkOut - more resources