

Associations between patterns of objectively measured physical activity and risk factors for the metabolic syndrome
- PMID: 20073381
- PMCID: PMC5666300
- DOI: 10.4278/ajhp.08051151
Associations between patterns of objectively measured physical activity and risk factors for the metabolic syndrome
Abstract
Purpose: To determine whether certain patterns of objectively measured physical activity (PA) are associated with the risk factors for or the diagnosis of the metabolic syndrome (MS).
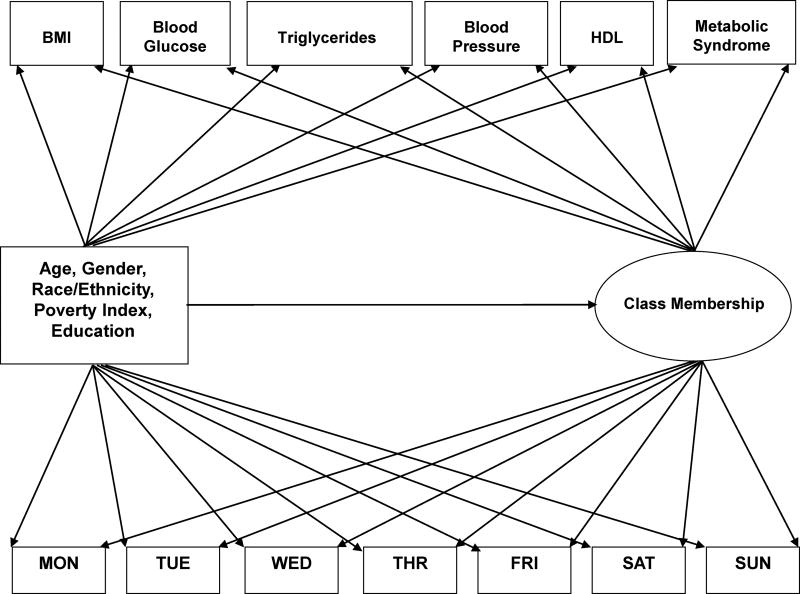
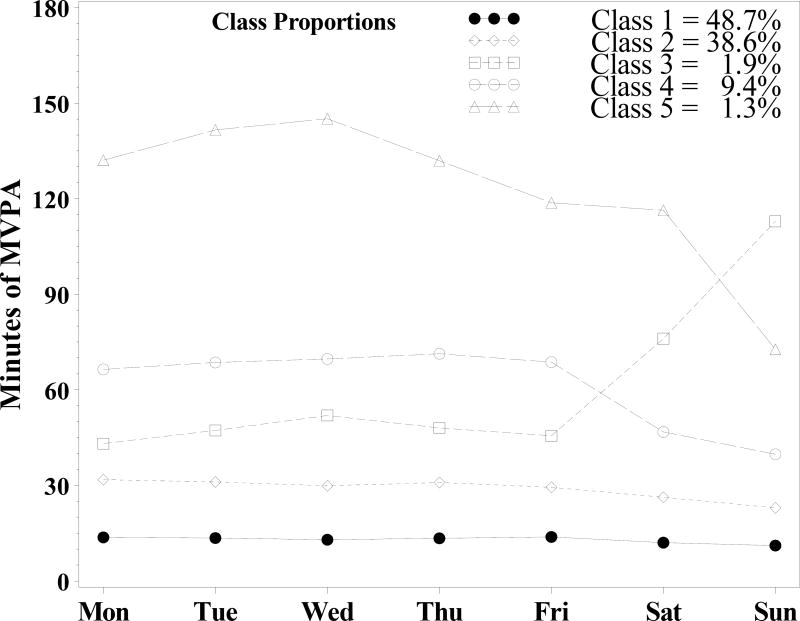
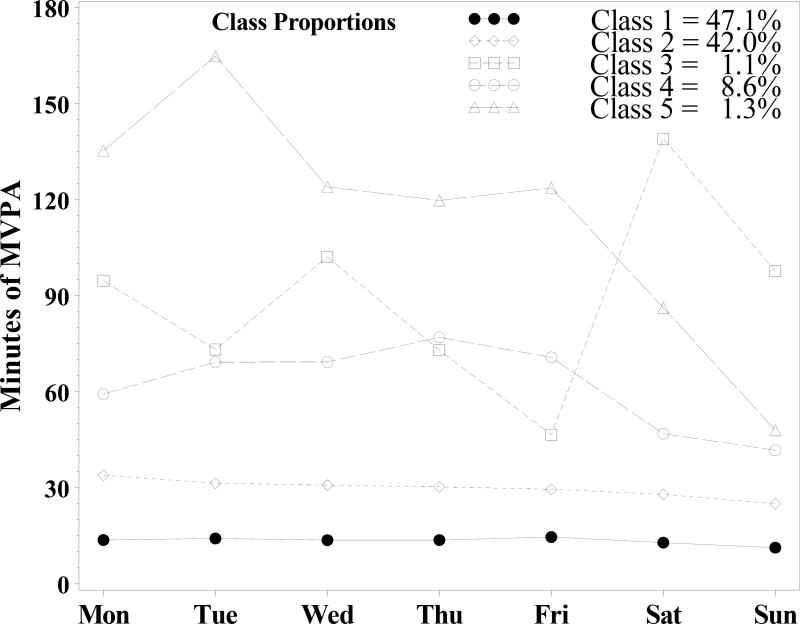
Design: Latent class analysis, including assessment of the associations between latent PA classes and risk factors for the MS.
Setting: Random sample from throughout the United States using data from the 2003-2004 National Health and Nutrition Examination Survey.
Subjects: A total of 3458 civilian adult noninstitutionalized U.S. citizens.
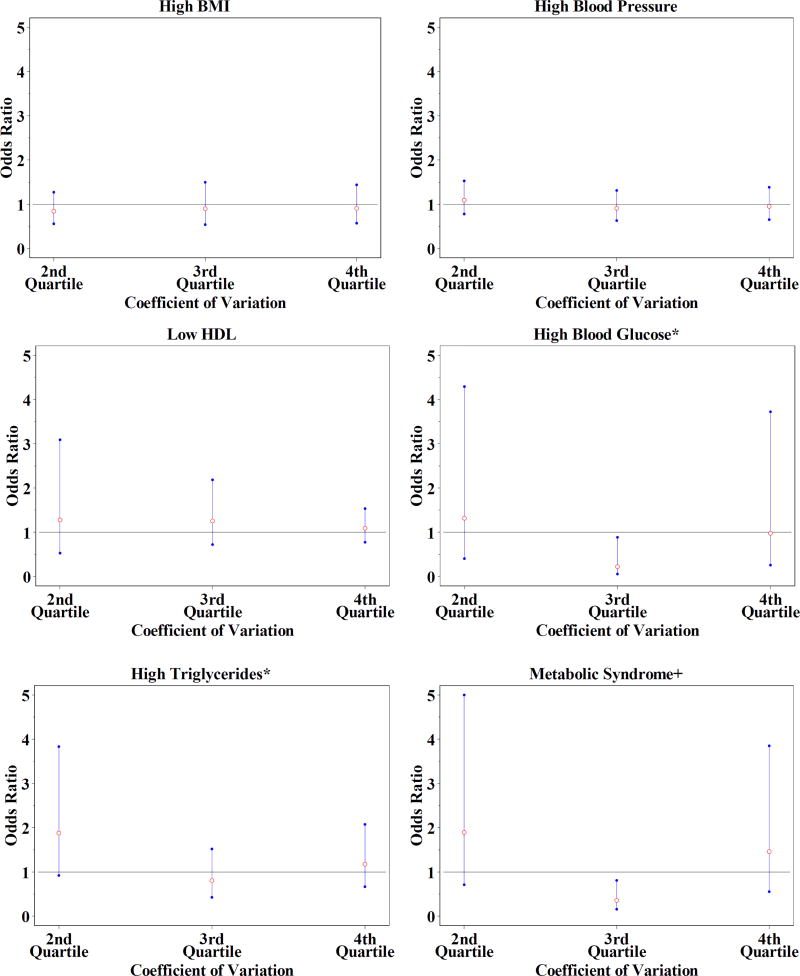
Measures: Daily minutes of moderate-to-vigorous PA across a 7-day week based on accelerometer measurements, as well as high blood pressure, blood glucose levels, triglyceride levels, and body mass index, along with low levels of high density lipoproteins, using clinical cut points.
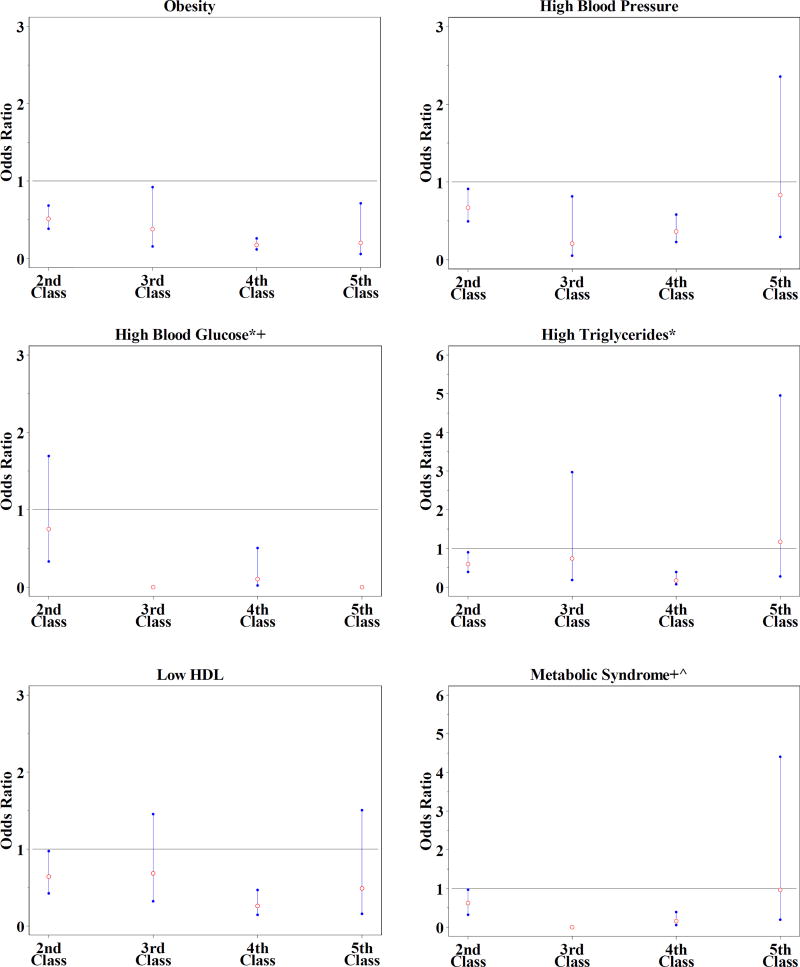
Results: Membership in the more active PA classes was consistently associated with lower odds of all risk factors for the MS. However, when participants were categorized into quartiles of the coefficients of variation of PA across 7 days, few differences were seen in any of the risk factors.
Conclusions: Accumulating the total weekly recommended amount of PA is consistently associated with positive health profiles, and more PA than the recommended amounts may be even better. However, the manner in which this activity is accumulated, either spread over most days of the week or compressed into just a couple of days, may have similar associations with the risk factors for the MS.
Figures
References
-
- Physical activity and cardiovascular health. NIH Consens Statement. 1995;13(3):1–33. - PubMed
-
- Grundy SM, Blackburn G, Higgins M, Lauer R, Perri MG, Ryan D. Physical activity in the prevention and treatment of obesity and its comorbidities: evidence report of independent panel to assess the role of physical activity in the treatment of obesity and its comorbidities. Med Sci Sports Exerc. 1999;31(11):1493–1500. - PubMed
-
- DiPietro L. Physical activity in the prevention of obesity: current evidence and research issues. Med Sci Sports Exerc. 1999;31(11 suppl):S542–546. - PubMed
-
- Centers for Disease Control and Prevention (CDC) Trends in leisure-time physical inactivity by age, sex, and race/ethnicity: United States, 1994–2004. MMWR Morb Mortal Wkly Rep. 2005;54(39):991–994. - PubMed
-
- Centers for Disease Control and Prevention (CDC) Adult participation in recommended levels of physical activity: United States, 2001 and 2003. MMWR Morb Mortal Wkly Rep. 2005;54(47):1208–1212. - PubMed
Publication types
MeSH terms
Grants and funding
LinkOut - more resources
Full Text Sources
Medical
