

Asymmetries in long-term and short-term plasticity at thalamic and cortical inputs to the amygdala in vivo
- PMID: 20074223
- PMCID: PMC3592337
- DOI: 10.1111/j.1460-9568.2009.07056.x
Asymmetries in long-term and short-term plasticity at thalamic and cortical inputs to the amygdala in vivo
Erratum in
- Eur J Neurosci.2010 Mar;31(5):950. Sigurdsson, Torfi [corrected to Siguròsson, Torfi]
Abstract
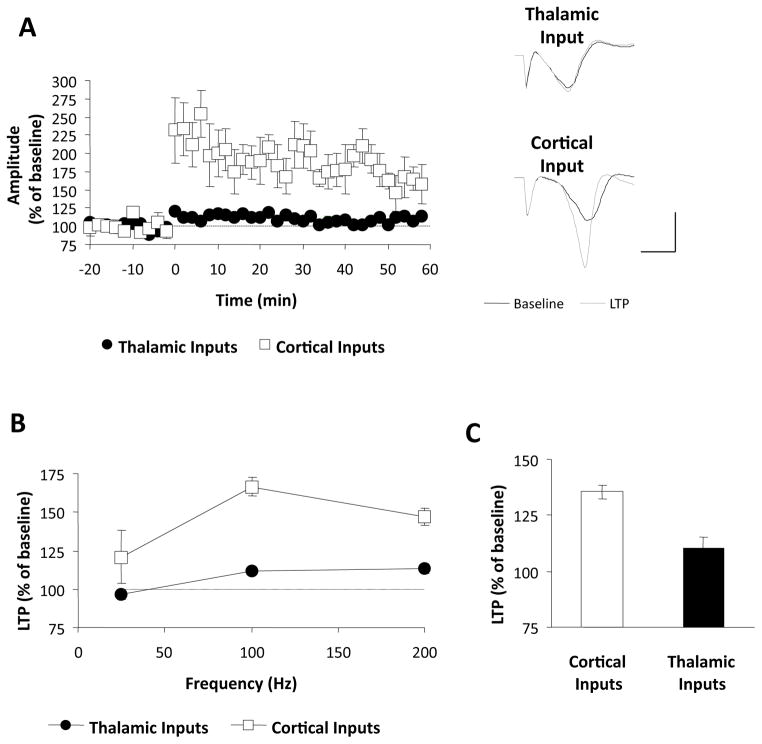
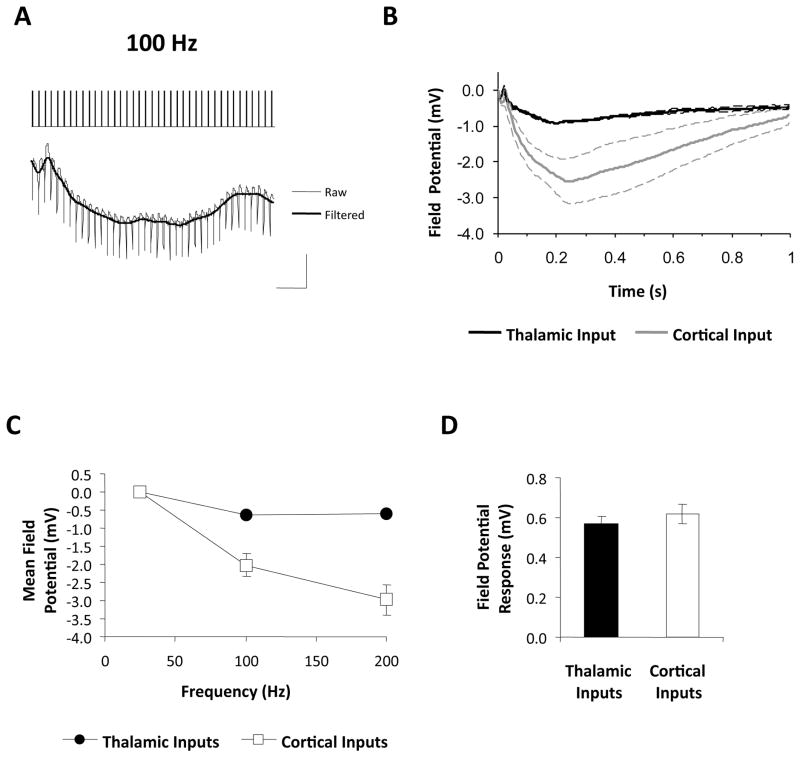
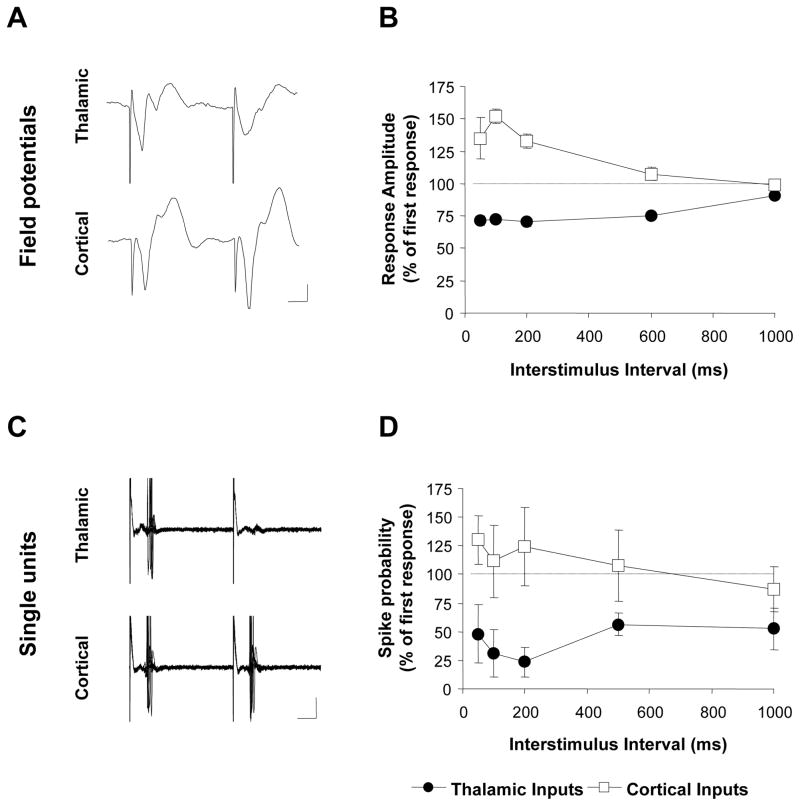
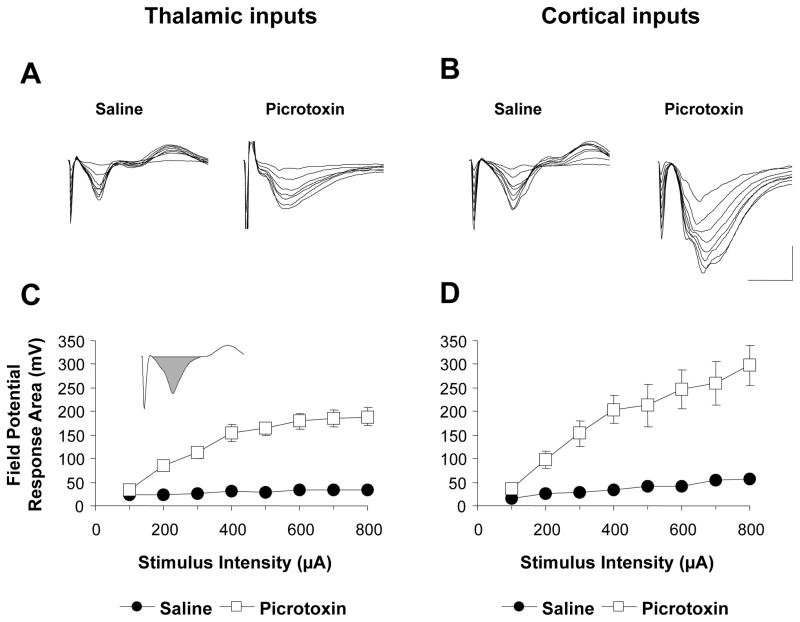
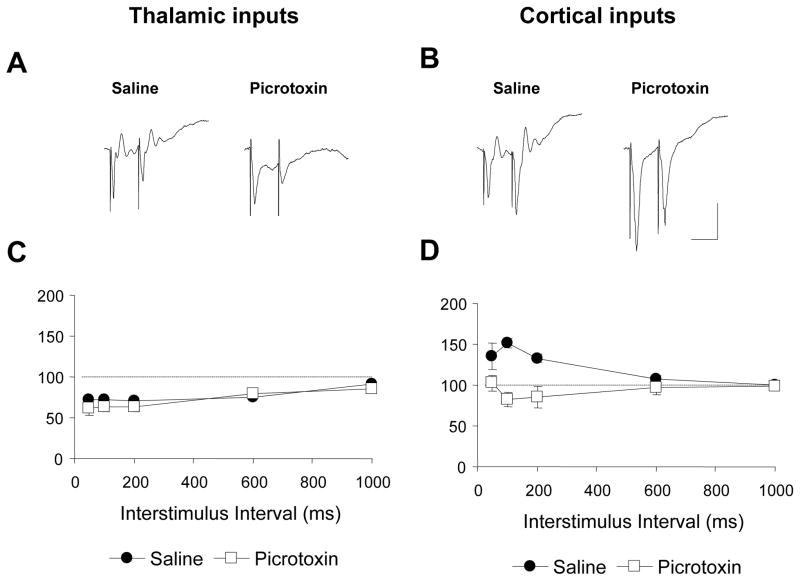
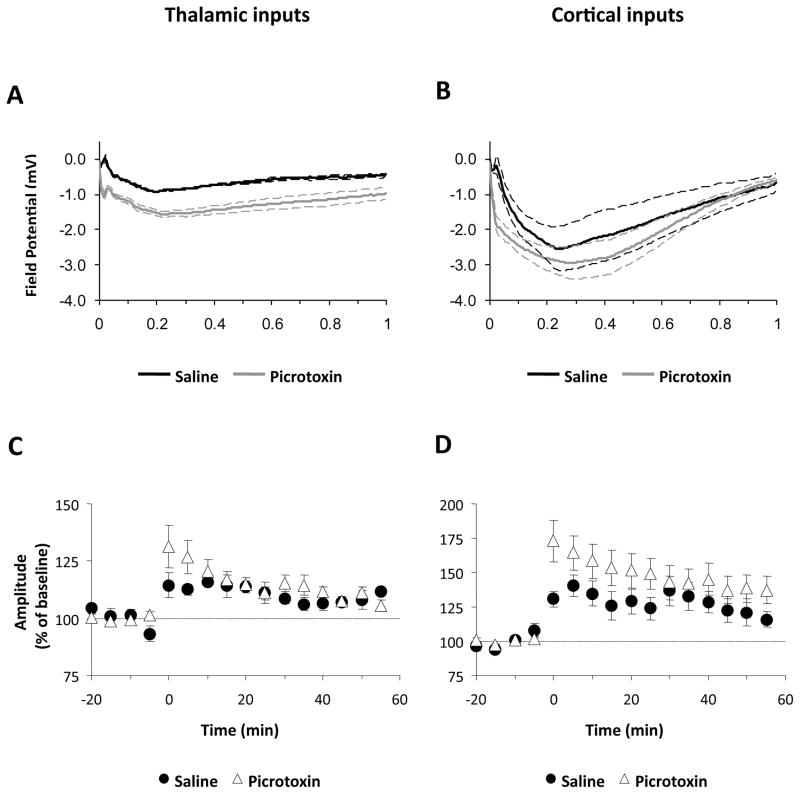
Converging lines of evidence suggest that synaptic plasticity at auditory inputs to the lateral amygdala (LA) is critical for the formation and storage of auditory fear memories. Auditory information reaches the LA from both thalamic and cortical areas, raising the question of whether they make distinct contributions to fear memory storage. Here we address this by comparing the induction of long-term potentation (LTP) at the two inputs in vivo in anesthetized rats. We first show, using field potential measurements, that different patterns and frequencies of high-frequency stimulation (HFS) consistently elicit stronger LTP at cortical inputs than at thalamic inputs. Field potential responses elicited during HFS of thalamic inputs were also smaller than responses during HFS of cortical inputs, suggesting less effective postsynaptic depolarization. Pronounced differences in the short-term plasticity profiles of the two inputs were also observed: whereas cortical inputs displayed paired-pulse facilitation, thalamic inputs displayed paired-pulse depression. These differences in short- and long-term plasticity were not due to stronger inhibition at thalamic inputs: although removal of inhibition enhanced responses to HFS, it did not enhance thalamic LTP and left paired-pulse depression unaffected. These results highlight the divergent nature of short- and long-term plasticity at thalamic and cortical sensory inputs to the LA, pointing to their different roles in the fear learning system.
Figures
Similar articles
-
Long-term potentiation in freely moving rats reveals asymmetries in thalamic and cortical inputs to the lateral amygdala.Eur J Neurosci. 2003 Jun;17(12):2703-15. doi: 10.1046/j.1460-9568.2003.02707.x. Eur J Neurosci. 2003. PMID: 12823477
-
Activity-dependent synaptic plasticity in the central nucleus of the amygdala.J Neurosci. 2005 Feb 16;25(7):1847-55. doi: 10.1523/JNEUROSCI.3713-04.2005. J Neurosci. 2005. PMID: 15716421 Free PMC article.
-
Fear memories induce a switch in stimulus response and signaling mechanisms for long-term potentiation in the lateral amygdala.Eur J Neurosci. 2004 Jul;20(2):549-56. doi: 10.1111/j.1460-9568.2004.03517.x. Eur J Neurosci. 2004. PMID: 15233764
-
Fear Learning: An Evolving Picture for Plasticity at Synaptic Afferents to the Amygdala.Neuroscientist. 2024 Feb;30(1):87-104. doi: 10.1177/10738584221108083. Epub 2022 Jul 13. Neuroscientist. 2024. PMID: 35822657 Review.
-
Synaptic plasticity in the lateral amygdala: a cellular hypothesis of fear conditioning.Learn Mem. 2001 Sep-Oct;8(5):229-42. doi: 10.1101/lm.30901. Learn Mem. 2001. PMID: 11584069 Review.
Cited by
-
Deep brain stimulation of the amygdala alleviates fear conditioning-induced alterations in synaptic plasticity in the cortical-amygdala pathway and fear memory.J Neural Transm (Vienna). 2014 Jul;121(7):773-82. doi: 10.1007/s00702-014-1183-5. Epub 2014 Mar 9. J Neural Transm (Vienna). 2014. PMID: 24610492
-
The basolateral amygdala is critical for learning about neutral stimuli in the presence of danger, and the perirhinal cortex is critical in the absence of danger.J Neurosci. 2013 Aug 7;33(32):13112-25. doi: 10.1523/JNEUROSCI.1998-13.2013. J Neurosci. 2013. PMID: 23926265 Free PMC article.
-
Synaptic location is a determinant of the detrimental effects of α-synuclein pathology to glutamatergic transmission in the basolateral amygdala.Elife. 2022 Jul 1;11:e78055. doi: 10.7554/eLife.78055. Elife. 2022. PMID: 35775627 Free PMC article.
-
Stability of presynaptic vesicle pools and changes in synapse morphology in the amygdala following fear learning in adult rats.J Comp Neurol. 2012 Feb 1;520(2):295-314. doi: 10.1002/cne.22691. J Comp Neurol. 2012. PMID: 21674493 Free PMC article.
-
Genetic labeling reveals novel cellular targets of schizophrenia susceptibility gene: distribution of GABA and non-GABA ErbB4-positive cells in adult mouse brain.J Neurosci. 2014 Oct 1;34(40):13549-66. doi: 10.1523/JNEUROSCI.2021-14.2014. J Neurosci. 2014. PMID: 25274830 Free PMC article.
References
-
- Abbott LF, Regehr WG. Synaptic computation. Nature. 2004;431:796–803. - PubMed
-
- Akopian G, Musleh W, Smith R, Walsh JP. Functional state of corticostriatal synapses determines their expression of short- and long-term plasticity. Synapse. 2000;38:271–280. - PubMed
-
- Armony JL, Servan-Schreiber D, Romanski LM, Cohen JD, LeDoux JE. Stimulus generalization of fear responses: effects of auditory cortex lesions in a computational model and in rats. Cereb Cortex. 1997;7:157–165. - PubMed
-
- Bissiere S, Humeau Y, Luthi A. Dopamine gates LTP induction in lateral amygdala by suppressing feedforward inhibition. Nat Neurosci. 2003;6:587–592. - PubMed
-
- Bliss TV, Collingridge GL. A synaptic model of memory: long-term potentiation in the hippocampus. Nature. 1993;361:31–39. - PubMed
Publication types
MeSH terms
Substances
Grants and funding
LinkOut - more resources
Full Text Sources
