. 2010 Jan 14:10:5.
doi: 10.1186/1471-213X-10-5.

Developmental cues and persistent neurogenic potential within an in vitro neural niche

Affiliations

Developmental cues and persistent neurogenic potential within an in vitro neural niche

Chris Pierret et al. BMC Dev Biol. .

Abstract

Background: Neurogenesis, the production of neural cell-types from neural stem cells (NSCs), occurs during development as well as within select regions of the adult brain. NSCs in the adult subependymal zone (SEZ) exist in a well-categorized niche microenvironment established by surrounding cells and their molecular products. The components of this niche maintain the NSCs and their definitive properties, including the ability to self-renew and multipotency (neuronal and glial differentiation).

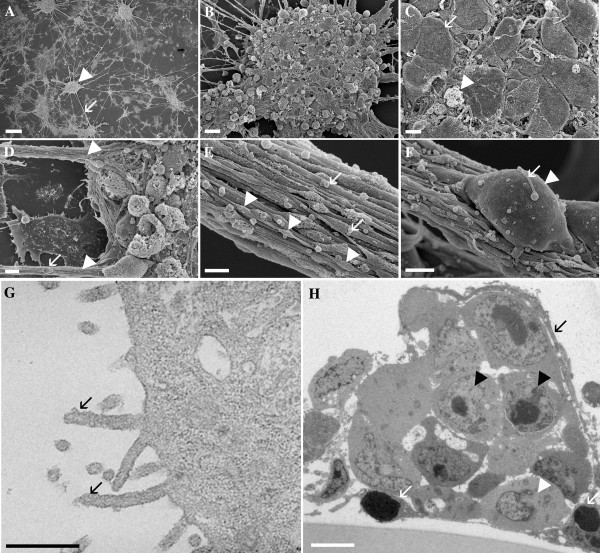
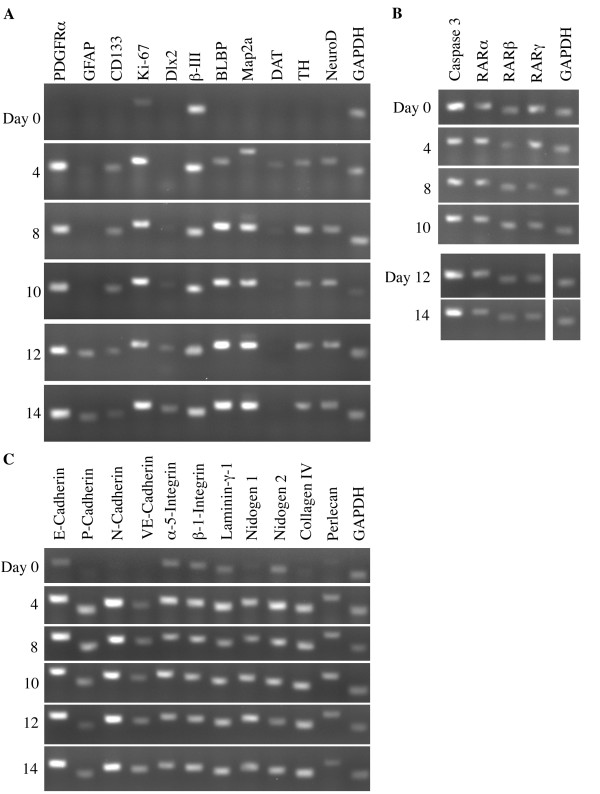
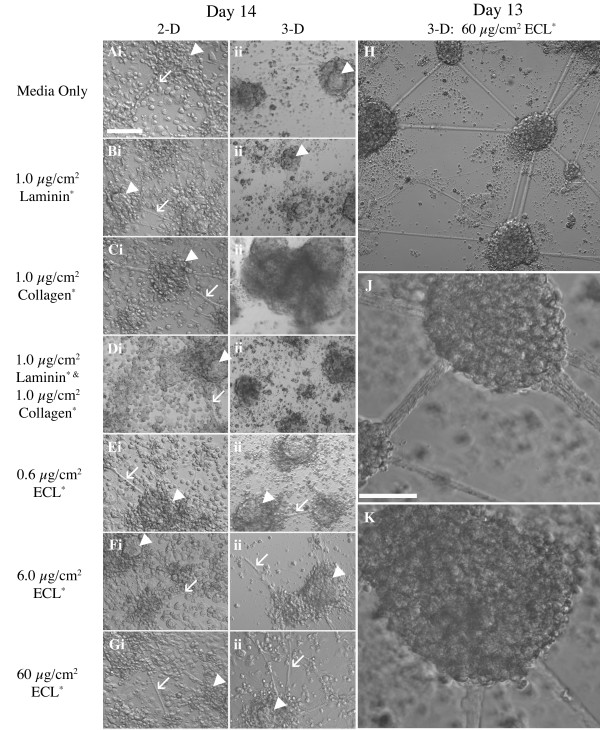
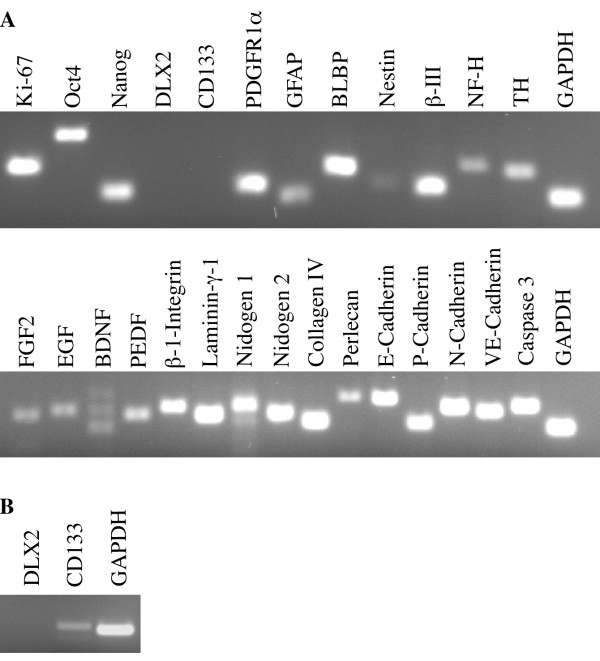
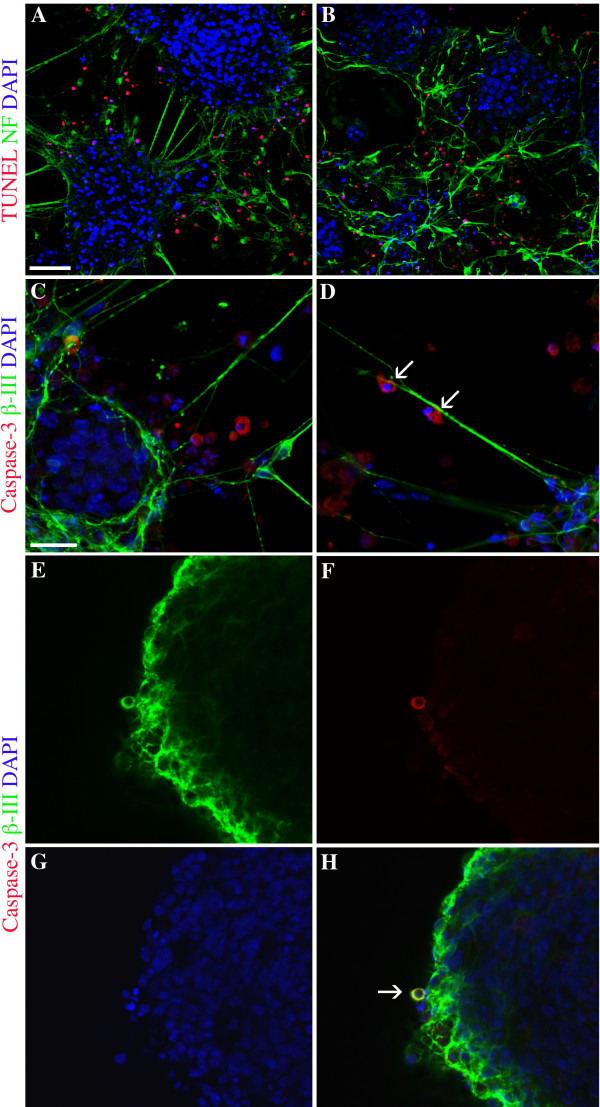
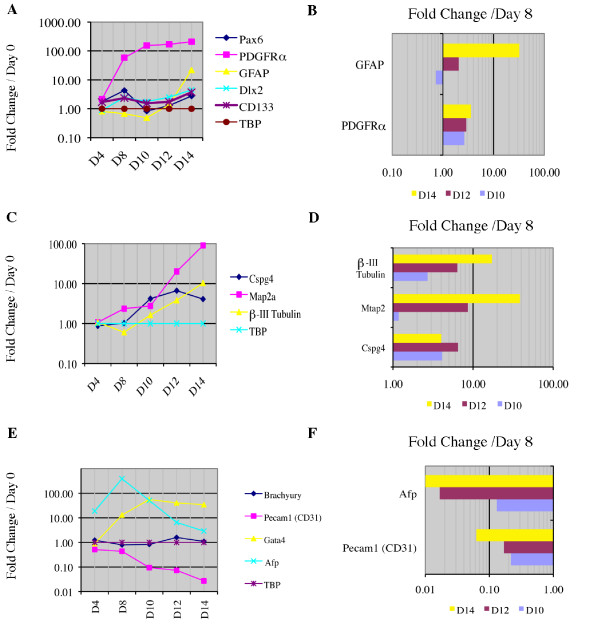
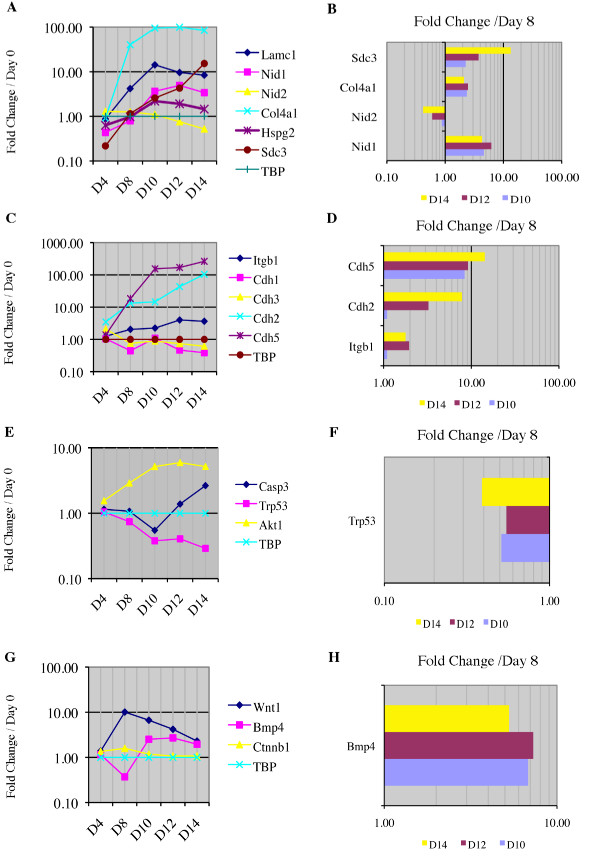
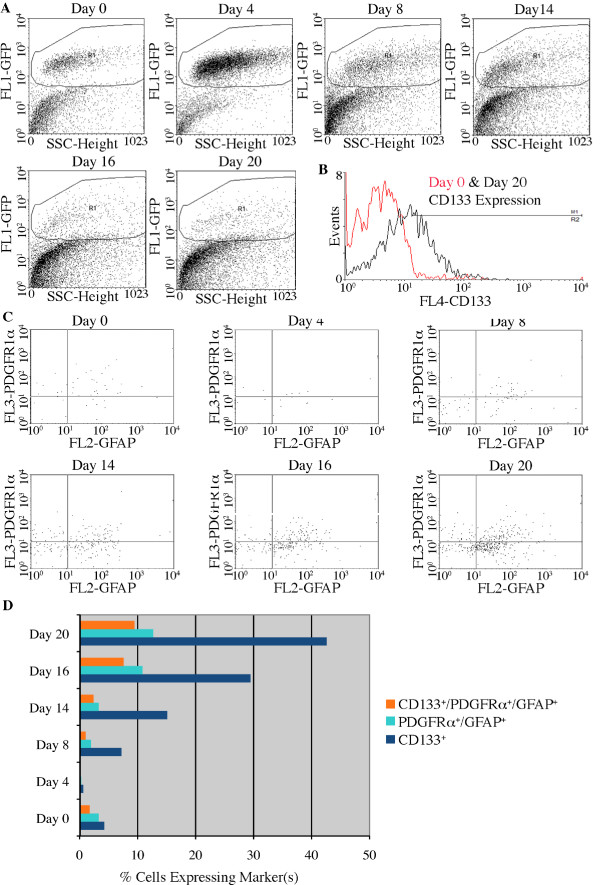
Results: We describe a model in vitro NSC niche, derived from embryonic stem cells, that produces many of the cells and products of the developing subventricular zone (SVZ) and adult SEZ NSC niche. We demonstrate a possible role for apoptosis and for components of the extracellular matrix in the maintenance of the NSC population within our niche cultures. We characterize expression of genes relevant to NSC self-renewal and the process of neurogenesis and compare these findings to gene expression produced by an established neural-induction protocol employing retinoic acid.

Conclusions: The in vitro NSC niche shows an identity that is distinct from the neurally induced embryonic cells that were used to derive it. Molecular and cellular components found in our in vitro NSC niche include NSCs, neural progeny, and ECM components and their receptors. Establishment of the in vitro NSC niche occurs in conjunction with apoptosis. Applications of this culture system range from studies of signaling events fundamental to niche formation and maintenance as well as development of unique NSC transplant platforms to treat disease or injury.


Figures

Figure 1
Figure 1
Scanning and Transmission Electron Microscopy (SEM and TEM) of the Day 14 in vitro NSC niche. A, SEM micrograph shows multicellular aggregates (arrowhead) and processes (arrow) between aggregates. Scale bar is 100 μm. B, Higher magnification of an aggregate shows many processes attached to a single aggregate. Scale bar is 10 microns. C, Cells of the aggregate shown in B include those with intact (arrow) and apoptotic (arrowhead) appearance. Scale bar is 3 μm. D, Cells (arrow) can be seen attached to processes (arrowheads). Scale bar is 3 μm. E, Magnification of D reveals the presence of varicosities (arrowheads) and blebs (arrows). Scale bar is 1 micron. F, Magnification of D including a cell (arrowhead) attached to the process. A very small process (arrow) is present on top of the migratory cell. Scale bar is 2 μm. G, TEM micrograph of a cell from the edge of an aggregate shows microvilli (arrows) and intracellular organelles. Scale bar is 0.5 μm. H, TEM micrograph of a section from an aggregate suggests the presence of cell-types. Scale bar is 4 μm.
Figure 2
Figure 2
RT-PCR profile of in vitro NSC niche by day of induction. Day 0 represents undifferentiated mouse embryonic stem cells. Day 4 and Day 8 represent suspended embryoid bodies during 4-/4+ retinoic acid neural induction; Day 4 cells are harvested prior to the addition of retinoic acid, and Day 8 is harvested after 4 days of retinoic acid exposure. Days 10, 12 and 14 represent time-points of further neural induction as attached cultures on ECL. A, Neural markers during culture development. B, Retinoic acid receptors and caspase-3 through Day 14. (Days 12 and 14 and their housekeeping gene run together but on a second gel) C, Extracellular matrix (ECM) components and receptors during culture development.
Figure 3
Figure 3
Light microscopy of 2- and 3-D cultures grown in the presence of various ECM components. Ai-Gi, Following 4-/4+ retinoic acid neural induction of mouse embryonic stem cells, the cells are plated in 96-well plates at 250,000 cells/cm2 on the substrate as indicated. Images are from Day 14 cultures. Aii-Gii, Cells are plated in 3-D using 0.15% Puramatrix hydrogel with the addition of the ECM substrate as indicated. In all panels, arrows indicate process development and arrowheads indicate compact aggregate formation. Images are from Day 14 cultures. H-K, Higher magnification of Day 13 cultures grown in PuraMatrix hydrogel at 60 μg/cm2 ECL reveals the best formation of in vitro NSC niche in 3-D of any conditions tested. All conditions tested produced in vitro neural niche in 2-D, but only 60 μg/cm2 ECL is able to consistently support its formation in 3-D. Scale bar in Ai is 100 μm and applies to panels Ai-H. Scale bar in J is 50 μm and applies to J and K. * Concentrations of ECM components are expressed per surface area of the culture well. ECM components for 3-D cultures are added at the same concentration as 2-D cultures. The volume of PuraMatrix assembled from 50 μl of 0.15% PuraMatrix in each well increases the surface area for ECM attachment, thus diluting the effective concentration of the ECM components. Note the 10-fold increase in effective concentration of ECM components in 3-D cultures as compared to 2-D cultures.
Figure 4
Figure 4
RT-PCR of Day 14 3-D cultures. A, Markers indicative of in vitro NSC niche development reveal that Dlx2 is not expressed at detectable levels in 3-D cultures. B, Increasing the total cDNA input for PCR reactions reveals low-level CD133 (but not Dlx2) expression in 3-D cultures.
Figure 5
Figure 5
Fluorescent antibody labelling indicates apoptotic cells in Day 14 in vitro NSC niche culture. A and B, TUNEL (shown in red) indicates apoptotic cells within the culture are found at the outer edge of aggregates and in the area between aggregates. Neurafilament (NF) (shown in green) labeling suggests that the apoptotic cells are localized among mature cells of the culture. C, Activated caspase-3 (shown in red) labeling further indicates apoptotic cells in areas between aggregates. β-III tubulin+ early neurons (in green) are indicated at the edge of the aggregate, within inter-aggregate processes and in the space between aggregates. D, Two cells expressing activated caspase-3 are shown along a neuronal process (labeled in green) between aggregates. E-H, Successive micrographs indicate a cell (arrow in H) that is positive for caspase-3 and β-III tubulin, indicating an apoptotic neuron. DAPI staining, shown in blue in all panels indicates nuclei. The scale bar in A is 50 μm and applies to A and B. Scale bar in C is 20 μm and applies to C-H.
Figure 6
Figure 6
Quantitative RT-PCR of genes indicative of particular developmental lineages. A, C and E, Fold changes in expression levels of (A) NSC-associated genes, (C) mature neural cell-associated genes, (E) mesodermal and endodermal-associated genes in the developing in vitro NSC niche compared to Day 0 mouse embryonic stem cell cultures. B, D and F, Fold changes of (B) NSC-associated genes, (D) mature neural cell-associated genes, (F) mesodermal and endodermal-associated genes in the developing in vitro NSC niche compared to cells that have undergone 4-/4+ retinoic acid induction (Day 8). Of the genes tested (see methods) only those genes with statistically significant (p < 0.05) differences from Day 8 cultures are shown. TATA box binding protein (TBP) is used as the housekeeping gene in all experiments. Data supporting our housekeeping gene selection are provided in Additional file 6. Genes: Paired box gene 6 (Pax6), Platelet derived growth factor receptor alpha (PDGFRα), Glial fibrillary acidic protein (GFAP), Distal-less homeobox 2 (Dlx2), Prominin 1 (Prom1, also CD133), Chondroitin sulfate proteoglycan 4 (Cspg4), Microtubule-associated protein 2 (Map2a), β-III tubulin, Brachyury, Platelet/endothelial cell adhesion molecule 1 (Pecam1), GATA binding protein 4 (Gata4), Alpha fetoprotein (Afp) and TATA box binding protein (TBP).
Figure 7
Figure 7
Quantitative RT-PCR of genes indicative of extracellular matrix proteins and receptors, apoptosis and Wnt signalling. A, C, E and G, Fold change of (A) extracellular matrix (ECM)-associated genes, (C) ECM receptor genes, (E) apoptosis-associated genes and (G) Wnt canonical pathway-associated genes in the developing in vitro NSC niche are compared to Day 0 mouse embryonic stem cell cultures. B, D, F and H, Fold change of (B) extracellular matrix-associated genes, (D) ECM receptor genes, (F) apoptosis-associated genes and (H) Wnt canonical pathway-associated genes in the developing in vitro NSC niche are compared to cells that have undergone 4-/4+ retinoic acid induction (Day 8). Only genes with statistically significant (p < 0.05) differences from Day 8 cultures are shown. TATA box binding protein (TBP) is used as the housekeeping gene in all experiments. Data supporting our housekeeping gene selection are provided in Additional file 6. Genes: Laminin, gamma 1 (Lamc1), Nidogen 1 (Nid1), Nidogen 2 (Nid2), Procollagen, type IV, alpha1 (Col4a1), Perlecan (Hspg2), Syndecan-3 (Sdc3), beta-1 Integrin (Itgb1), Cadherin 1 (Cdh1, E-cadherin), Cadherin 3 (Cdh3, P-cadherin), Cadherin 2 (Cdh2, N-cadherin), Cadherin 5 (Cdh5, VE-cadherin), Caspase-3 (Casp3), Transformation related protein 53 (Trp53), thymoma viral proto-oncogene 1 (Akt1), Wingless-related MMTV integration site 1 (Wnt1), Bone morphogenetic protein 4 (Bmp4), beta-1 Catenin, (Ctnnb1) and TATA box binding protein (TBP).
Figure 8
Figure 8
Cell sorting analysis demonstrates the presence of putative NSCs resident in the in vitro NSC niche. A, Gates for "live" cells included dot plot of side scatter (ssc) versus GFP fluorescence (FL1-GFP). The cellular population was fairly uniform in scatter on Days 0-8, but showed greater variety in Days 14-20 as the GFP+ cells adopt their mature cell-fates. B, There is an increase in the number of CD133 labeled cells on Day 20 when compared to Day 0. C, Cells gated through the live gate in (A) and the CD133+ gate in (B) are further analyzed for PDGFRα and GFAP expression. The upper right quadrant indicates cells that are positive for all three markers. D, Percentages of cells on different days of culture that express CD133, PDGFRα and GFAP, or all three markers. Day 0 represents undifferentiated mouse embryonic stem cells in culture; Days 4 and 8 are taken from cells during the 4-/4+ neural induction; Days 14, 16 and 20 are taken from cells in the in vitro NSC niche after the 4-/4+ neural induction.

Similar articles

Cited by

References

    1. Alvarez-Buylla A, Lim DA. For the long run: maintaining germinal niches in the adult brain. Neuron. 2004;41:683–686. doi: 10.1016/S0896-6273(04)00111-4. - DOI - PubMed
    1. Casper KB, McCarthy KD. GFAP-positive progenitor cells produce neurons and oligodendrocytes throughout the CNS. Mol Cell Neurosci. 2006;31:676–684. doi: 10.1016/j.mcn.2005.12.006. - DOI - PubMed
    1. Conover JC, Notti RQ. The neural stem cell niche. Cell Tissue Res. 2008;331:211–224. doi: 10.1007/s00441-007-0503-6. - DOI - PubMed
    1. Doetsch F. A niche for adult neural stem cells. Curr Opin Genet Dev. 2003;13:543–550. doi: 10.1016/j.gde.2003.08.012. - DOI - PubMed
    1. Doetsch F, Caille I, Lim DA, Garcia-Verdugo JM, Alvarez-Buylla A. Subventricular zone astrocytes are neural stem cells in the adult mammalian brain. Cell. 1999;97:703–716. doi: 10.1016/S0092-8674(00)80783-7. - DOI - PubMed

Publication types