. 2010 Jan 6;98(1):1-11.
doi: 10.1016/j.bpj.2009.09.055.

Stochastic bistability and bifurcation in a mesoscopic signaling system with autocatalytic kinase

Affiliations

Stochastic bistability and bifurcation in a mesoscopic signaling system with autocatalytic kinase

Lisa M Bishop et al. Biophys J. .

Abstract

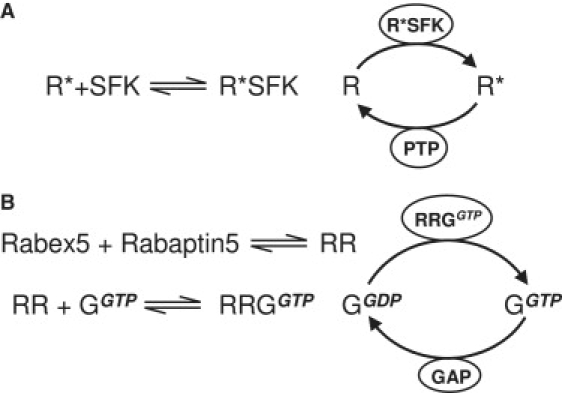
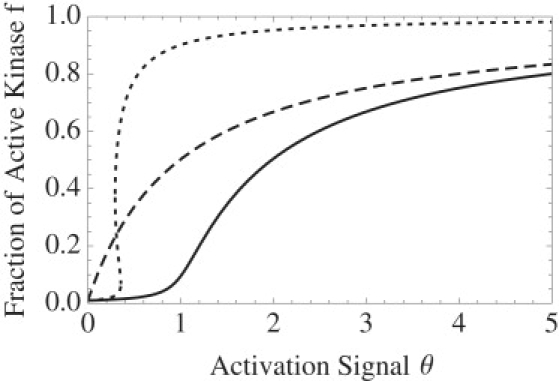
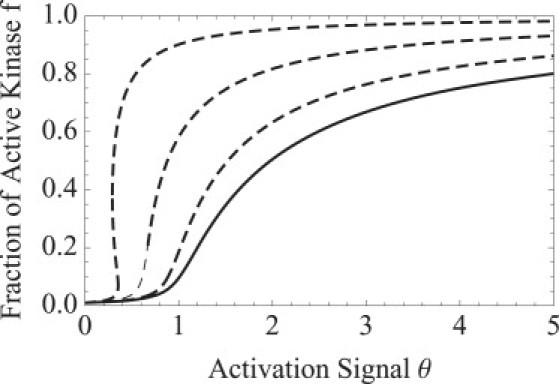
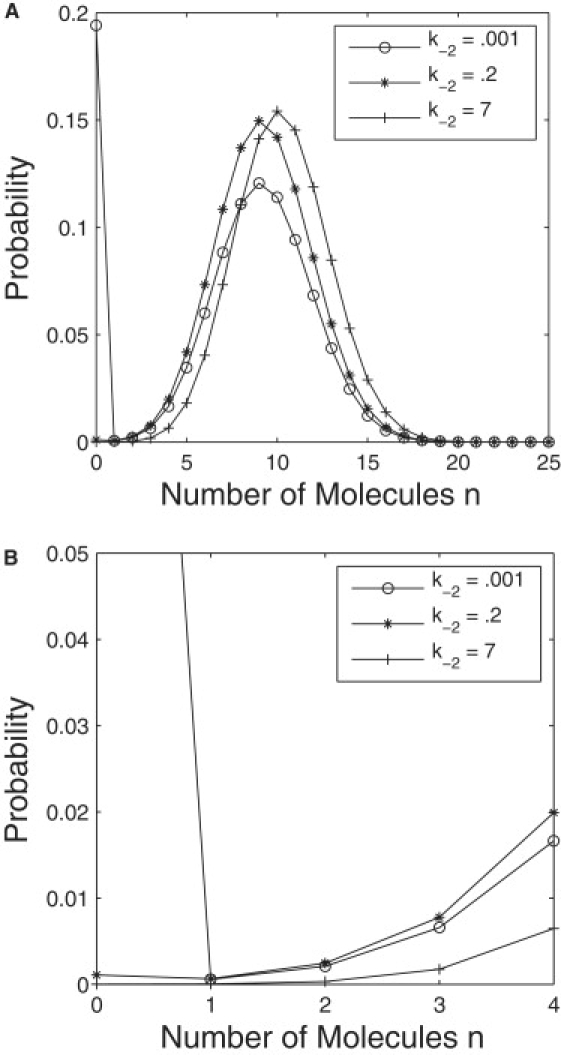
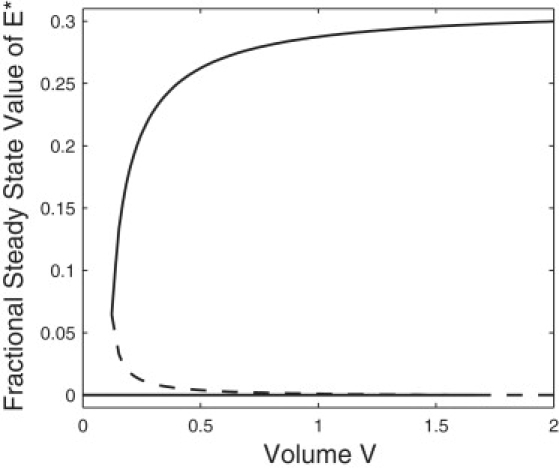
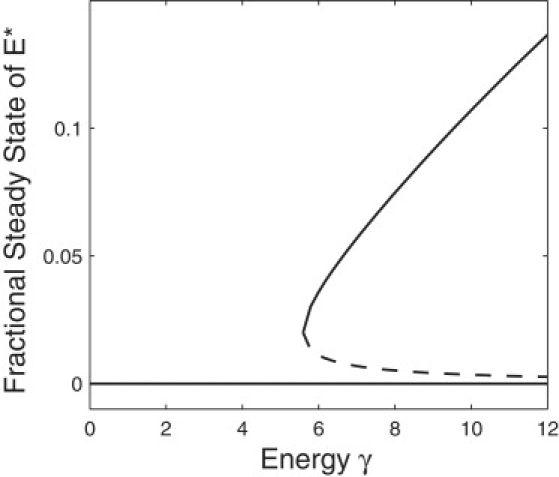
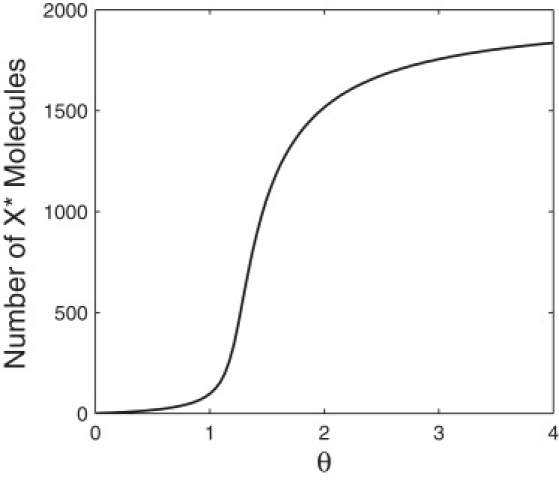
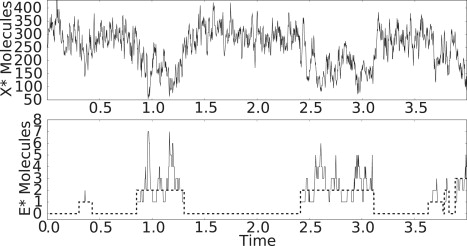
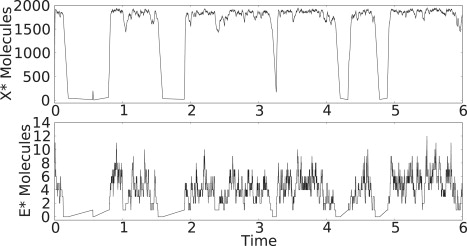
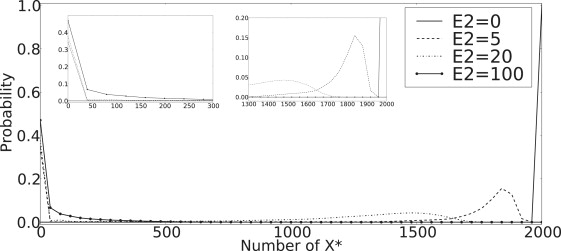
Bistability is a nonlinear phenomenon widely observed in nature including in biochemical reaction networks. Deterministic chemical kinetics studied in the past has shown that bistability occurs in systems with strong (cubic) nonlinearity. For certain mesoscopic, weakly nonlinear (quadratic) biochemical reaction systems in a small volume, however, stochasticity can induce bistability and bifurcation that have no macroscopic counterpart. We report the simplest yet known reactions involving driven phosphorylation-dephosphorylation cycle kinetics with autocatalytic kinase. We show that the noise-induced phenomenon is correlated with free energy dissipation and thus conforms with the open-chemical system theory. A previous reported noise-induced bistability in futile cycles is found to have originated from the kinase synchronization in a bistable system with slow transitions, as reported here.


Figures

Figure 1
Figure 1
Two examples of autophosphorylation in cell biology. (A) In Src family kinase (SFK) signaling pathway, the phosphorylation of a membrane receptor, from R to R, is catalyzed by an activated SFK. The activation of the SFK, however, is assisted by its association with phosphorylated receptor and the formation of RSFK complex. Dephosphorylation of R is catalyzed by a protein tyrosine phosphatase (PTP). (B) In endocytic pathway, the activation of Rab5 GTPase, from its GDP-bound state GGDT to GTP-bound state GGTP, is catalyzed by activated Rabex-5, a guanine nucleotide exchange factor. The activation of the Rabex-5, however, is assisted by its association with the GGTP via another regulator called Rabaptin-5. The GTP hydrolysis carried out by Rab5 is accelerated by a GTPase accelerating protein (GAP).
Figure 2
Figure 2
Level of activation in response to signal θ, the ratio of kinase to phosphatase concentrations, of an autophosphorylated system modeled with Mass Action kinetics (solid) from Eq. 6; Michaelis-Menten kinetics (dotted) from Eq. 17; and contrasted with a system without autophosphorylation (dashed) from Eq. 7. Symbols: γ = 108, μ = 0.01, K3 = 0.1, and K4 = 1.
Figure 3
Figure 3
Level of activation in response to signal θ, the ratio of kinase to phosphatase concentrations of an autophosphorylated system according to Michaelis-Menten kinetics in Eq. 17 plotted in the dashed curves. (Top to bottom) The Michaelis constants in Eq. 14, (K3, K4) = {(0.1, 1), (0.5, 2) (2,10), and (∞, ∞)}, and (solid curve) K3 = K4 = ∞ shows that first-order Michaelis-Menten reduces to the Mass Action model from Eq. 6. Other parameter values are γ = 108, μ = 0.01, and ET = 1.
Figure 4
Figure 4
Two views of the steady-state distribution of the number of active kinase, N, from Eq. 20. Parameter values are k1 = 5, k−1 = 10, k2 = 10, Nt = 30, and k−2 varied.
Figure 5
Figure 5
Stochastic bifurcation plot of the fractional steady-state values of activated kinase, n/Nt from Eq. 22, as a function of the volume V. The solid curves represent the maxima of the steady-state distribution, and the dashed curve represents the minimum of the distribution. Parameter values, k^1=5, k^1=10, k2 = 10, Et = 30, and k−2 = 0.2. The dashed line intersects the zero axis at V = 1.67, beyond which there is only one nonzero maximum in agreement with the range from Eq. 24.
Figure 6
Figure 6
Stochastic bifurcation plot of the fractional steady-state values of activated kinase, n/Nt from Eq. 22, as a function of the parameter γ. Parameter values, k^1=10, k2 = 10, Nt = 30, and k−2 = 0.2. The value γ was varied by varying k1.
Figure 7
Figure 7
Comparison of MATLAB solution to λ1 with eigenvalue computed from Eq. 29 using the analytic MFPT as in Eq. 30 and Gardiner (31). Parameter values, k^1=5, k^1=10, k2 = 10, and Et = 30. (a) k−2 = 0.2; (b) k−2 = 0.001.
Figure 8
Figure 8
Stochastic trajectory of the activated kinase in a fluctuating autophosphorylation reaction Eq. 1. The sample trajectory was generated using the Gillespie algorithm with parameter values, k^1=5, k^1=10, k2 = 10, k−2 = 0.001, and Nt = 30. For each segment of nonzero fluctuations, the average was taken and plotted (dashed line). This plot represents a two-state trajectory as in Eq. 33.
Figure 9
Figure 9
Solution equation, Eq. 37, applied to the deterministic Michaelis-Menten model for the PdPC system in Eq. 34 without fluctuating kinase activity.
Figure 10
Figure 10
Stochastic trajectories from Gillespie simulation of X in PdPC cycle in Eq. 34 with fluctuating E given in Eq. 1. One can see the effect of the kinase bistability on the fluctuation of X molecules.
Figure 11
Figure 11
Sample trajectory for modified system with E as kinase. Here X is plotted. Parameters are changed, so E2 = 5. k1 = 2 and k−2 = 0.05.
Figure 12
Figure 12
Probability distribution from Gillespie simulation where E acts as the kinase replacing E in Eq. 34. Phosphatase values are varied to alter θ-values. k1 = 2 and k−2 = 0.05; remaining parameters are as in Eq. 35.

References

    1. Pearson H. Cell biology: the cellular hullabaloo. Nature. 2008;453:150–153. - PubMed
    1. Süel G.M., Kulkarni R.P., Elowitz M.B. Tunability and noise dependence in differentiation dynamics. Science. 2007;315:1716–1719. - PubMed
    1. Kaern M., Elston T.C., Collins J.J. Stochasticity in gene expression: from theories to phenotypes. Nat. Rev. Genet. 2005;6:451–464. - PubMed
    1. Paulsson J. Models of stochastic gene expression. Phys. Life Rev. 2005;2:157–175.
    1. Raser J.M., O'Shea E.K. Control of stochasticity in eukaryotic gene expression. Science. 2004;304:1811–1814. - PMC - PubMed

Publication types

Substances

LinkOut - more resources