. 2010 Jan;11(1):23-34.
doi: 10.1016/j.cmet.2009.11.006.

Cdc2-like kinase 2 is an insulin-regulated suppressor of hepatic gluconeogenesis

Affiliations

Cdc2-like kinase 2 is an insulin-regulated suppressor of hepatic gluconeogenesis

Joseph T Rodgers et al. Cell Metab. 2010 Jan.

Abstract

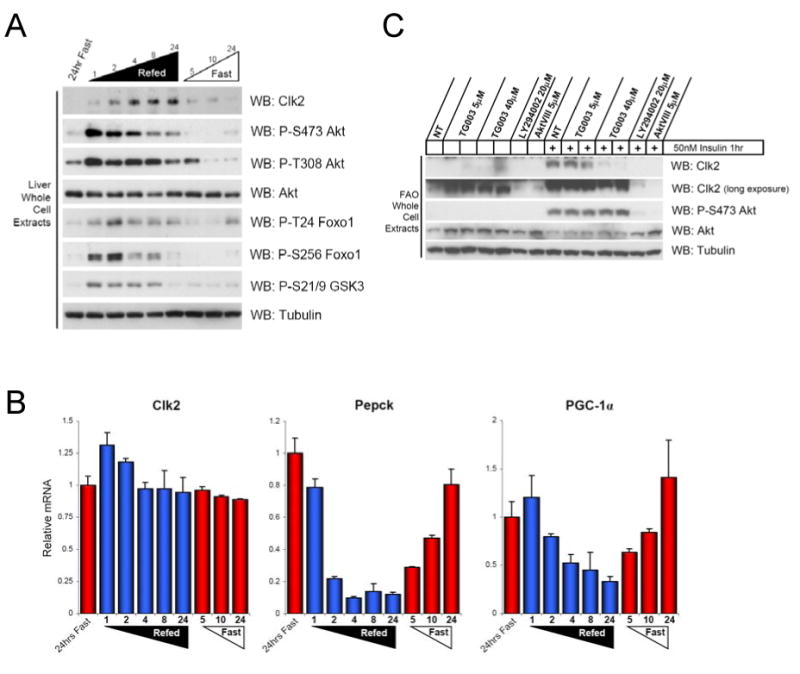
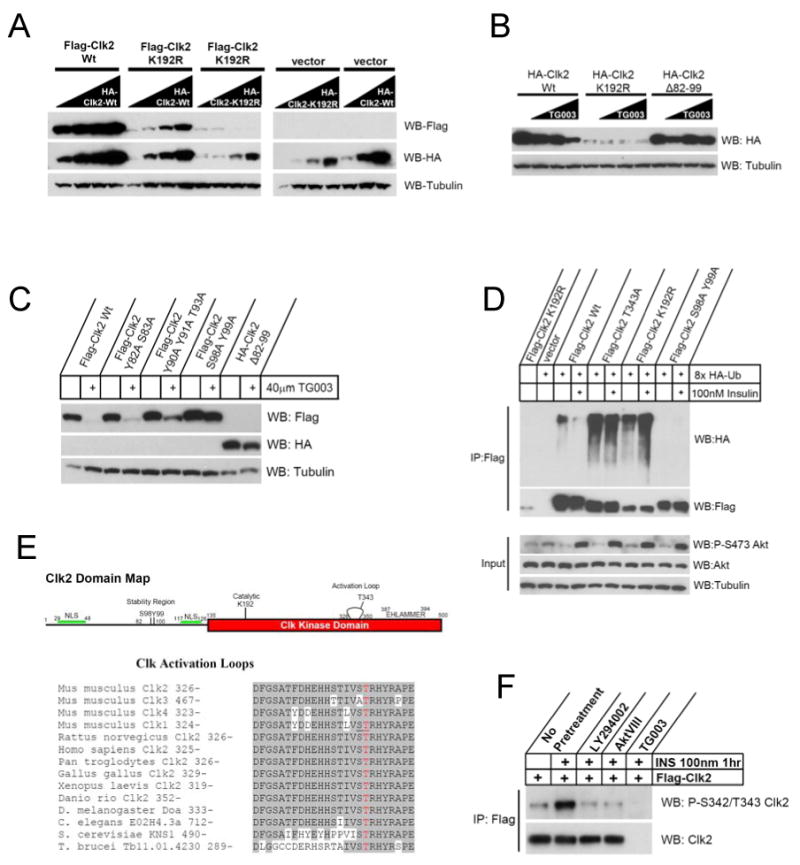
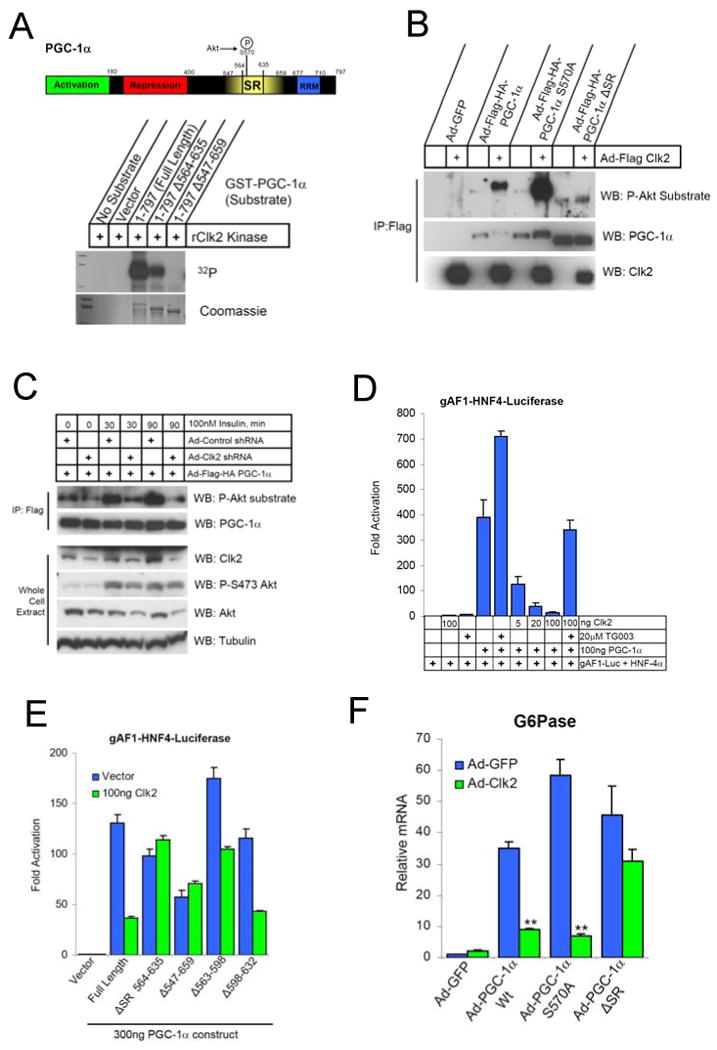
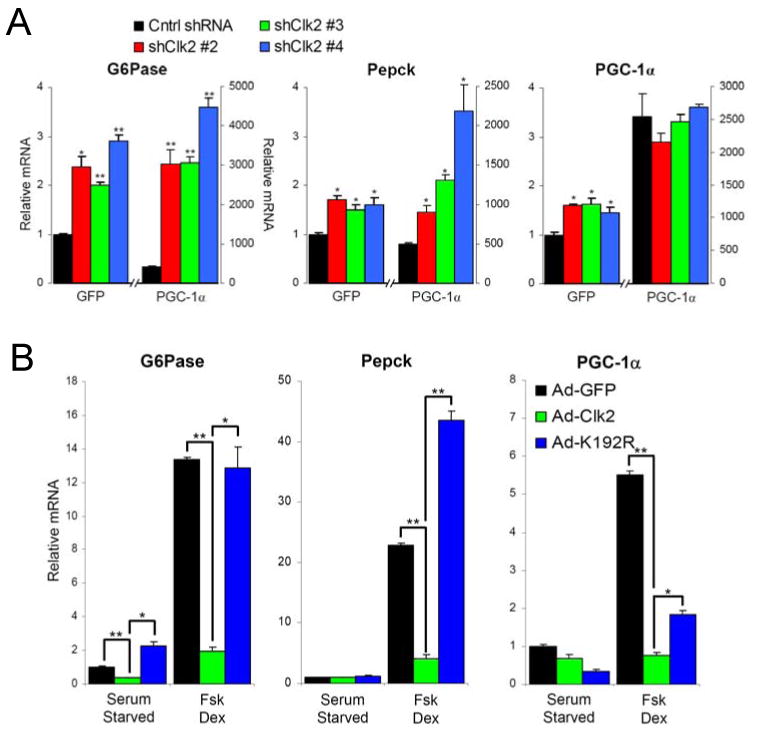
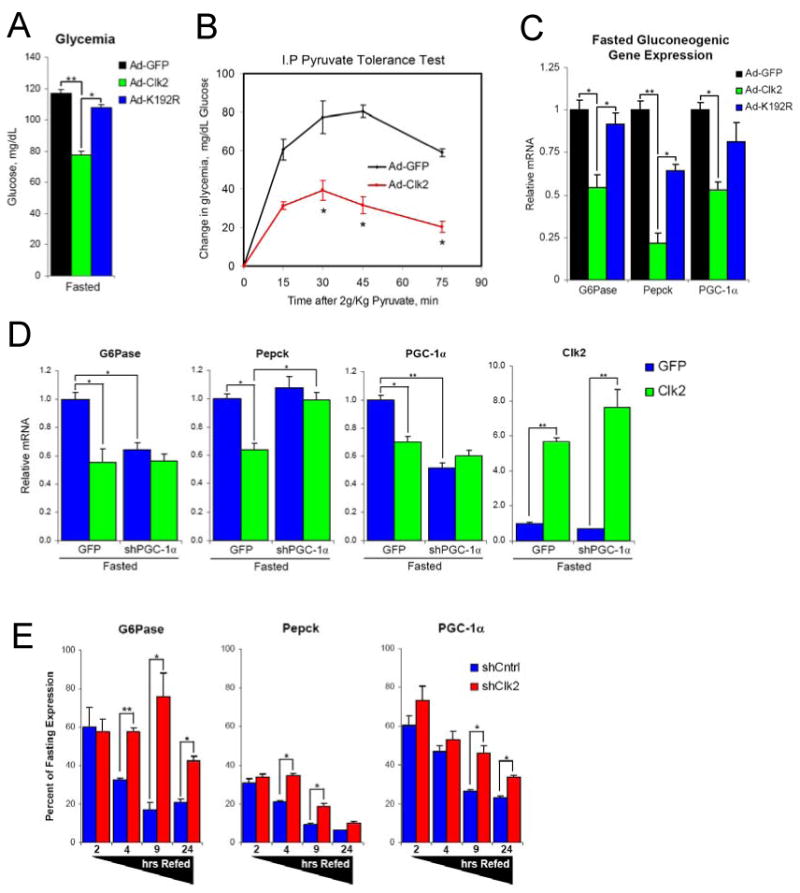
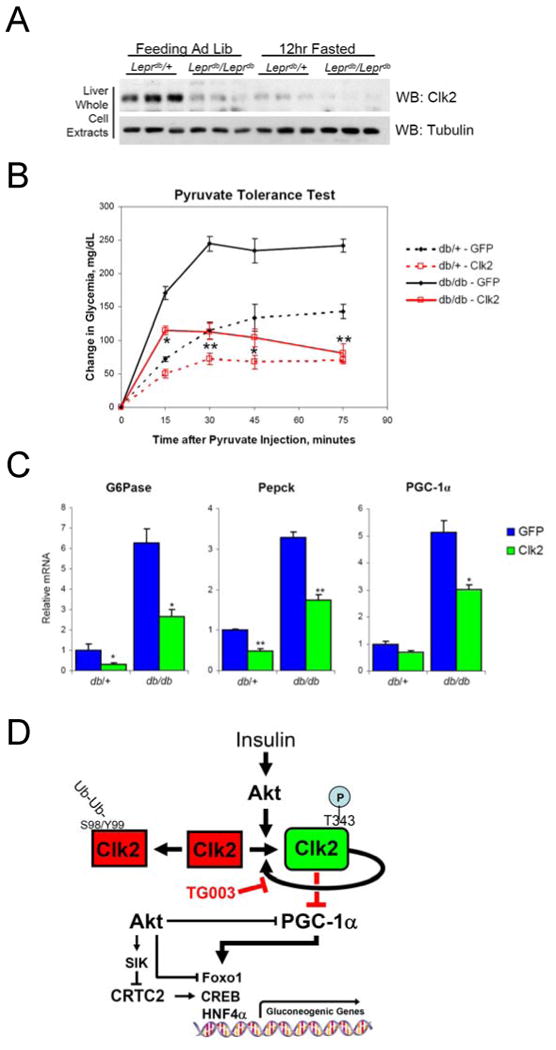
Dynamic regulation of insulin signaling and metabolic gene expression is critical to nutrient homeostasis; dysregulation of these pathways is widely implicated in insulin resistance and other disease states. Though the metabolic effects of insulin are well established, the components linking insulin signal transduction to a metabolic response are not as well understood. Here, we show that Cdc2-like kinase 2 (Clk2) is an insulin-regulated suppressor of hepatic gluconeogenesis and glucose output. Clk2 protein levels and kinase activity are induced as part of the hepatic refeeding response by the insulin/Akt pathway. Clk2 directly phosphorylates the SR domain on PGC-1alpha, resulting in repression of gluconeogenic gene expression and hepatic glucose output. In addition, Clk2 is downregulated in db/db mice, and reintroduction of Clk2 largely corrects glycemia. Thus, we have identified a role for and regulation of the Clk2 kinase as a component of hepatic insulin signaling and glucose metabolism.


Figures

Figure 1
Figure 1. Clk2 is regulated by feeding/fasting and insulin
(A) Clk2 protein is induced in the mouse liver by refeeding. Western Blot analysis of liver whole cell extracts from mice sacrificed at indicated time during a feeding-fasting-refeeding time course. (B) Clk2 mRNA levels are not regulated by fasting/feeding in the mouse liver. Q-RT-PCR analysis of Clk2, Pepck, and PGC-1α gene expression from total liver RNA isolated from mice in (A). Data presented as average +/- SEM, each bar N=2-3. (D) Clk2 protein is induced by insulin downstream of PI3K and Akt. Whole cell extracts from FAO hepatoma cells grown in RPMI + 0.5%BSA for 24 hours and treated with indicated inhibitor overnight prior to insulin stimulation for 1 hour.
Figure 2
Figure 2. Clk2 kinase activity controls Clk2 protein stability
(A) Wt Clk2 rescues stability of kinase dead mutant. HEK293 cells were transfected with constant amounts of indicated Flag tagged Clk2 construct with increasing amounts of indicated HA-Clk2 construct. All transfection amounts were normalized with empty vector plasmid. (B) TG003 induces Clk2 degradation. Western blot analysis of HEK293 cells transfected with indicated Clk2 construct overnight prior to a 1 hour treatment with 0, 10, 20, or 40μM TG003. (C) TG003 degradation of Clk2 is dependent on residues S98 and Y99. Western blot analysis of HEK293 cells transfected with indicated Clk2 constructs and treated with 40μM TG003 1 hour prior to harvest. (D) Clk2 ubiquitination. Western blot analysis of whole cell extracts (input) or following Flag immunoprecipitation (IP:Flag) of H2.35 hepatocytes transfected with indicated Clk2 construct and 8xHA-ubiquitin. Cells were serum starved overnight prior to treatment with 10μM MG132 +/- 100nM insulin for 2 hours. (E) Alignment of Clk activation loops. Amino acid residues shaded in gray indicate conservation to Mus musculus Clk2. Red residue indicates T343. Residues underlined on Mus Clk1 were found to be phosphorylated in crystal structure of human Clk1 (PDB: 2VAG). (F) Phosphorylation at S342/T343 is induced upon insulin stimulation in H2.35 hepatocytes transfected with Flag-Clk2, serum starved prior to treatment with indicated inhibitor for 30 minutes prior to stimulation with insulin for 1 hour.
Figure 3
Figure 3. Clk2 phosphorylates and represses PGC-1α transcriptional coactivator
(A) Domain map and in vitro phosphorylation of PGC-1α with indicated deletion by purified recombinant Clk2 kinase (rClk2) in the presence of γ32P-ATP reaction conditions described in Experimental Procedures. (B) Clk2 induces PGC-1α SR domain phosphorylation recognized by P-Akt substrate antibodies. Western blot analysis of Flag immunoprecipitates from Primary Hepatocytes infected with indicated adenoviruses, all viral loads were normalized with Ad-GFP. (C) Clk2 shRNA block insulin induction of PGC-1α phosphorylation. Western blot analysis of flag immunoprecipitates (IP:Flag) and whole cell extracts of H2.35 hepatocytes infected with indicated adenoviruses. Cells were serum starved overnight prior to insulin stimulation as indicated. PGC-1α transcription co-activation assay in (D) HE3K293 cells and (E) H2.35 hepatocytes using HNF-4α and gAF1-luiferase reporter performed as described in Experimental Procedures. (F) Q-RT-PCR analysis of G6Pase expression in total RNA from primary hepatocytes infected with indicated adenoviruses. Data is presented as average +/- SEM. Significance determined by unpaired two-tailed Students T-Test, ** P<0.01.
Figure 4
Figure 4. Clk2 represses gluconeogenic gene expression in primary hepatocytes
(A) Clk2 shRNA induces gluconeogenic gene expression. Q-RT-PCR analysis of total RNA from primary hepatocytes infected with GFP or PGC-1α and Control shRNA or Clk2 shRNA adenoviruses. Cells were grown for 2 days post infection in DMEM + 10%FBS. Each bar N=4. (B) Clk2 expression suppresses gluconeogenic gene expression. Q-RT-PCR analysis of total RNA from primary hepatocytes infected with GFP, Clk2, or Clk2 K192R adenoviruses. 24 hours after infection Cells were switched to starvation media 6 hours prior to treatment with 10μM forskolin and 1 μM dexamethasome for 1.5 hours. Each bar N=4. All data is presented as average +/- SEM. Experiments performed at least 3 times with similar results. Significance determined by two-tailed unpaired Students T-Test * denotes P<0.05, ** P<0.01.
Figure 5
Figure 5. Clk2 represses hepatic glucose output and causes hypoglycemia in vivo
(A) Hepatic Clk2 expression causes fasting hypoglycemia. Glycemia from mice infected with GFP, Clk2 or Clk2 K192R adenoviruses following a 9 hour fast. Each bar N=6-9. (B) Clk2 suppresses hepatic glucose production in a pyruvate tolerance test. Intra-peritoneal (I.P.) pyruvate tolerance test from mice infected with GFP (N=4) or Clk2 (N=5) adenoviruses. Mice fasted overnight prior to injection of 2g/kg sodium pyruvate. Data is presented as change in glycemia following pyruvate injection. (C) Clk2 suppresses hepatic gluconeogenic gene expression in vivo. Q-RT-PCR analysis of gluconeogenic gene expression from total liver RNA from mice infected with GFP (N=5), Clk2 (N=6), or Clk2 K192R (N=3) adenoviruses following a 9 hour fast. (D) Clk2 suppression of gluconeogenesis requires PGC-1α. Q-RT-PCR analysis of gene expression from mice infected with indicated adenovirus, fasted overnight prior to sacrifice, each bar N=4. (E) Hepatic Clk2 knock-down impairs refeeding suppression of gluconeogenic gene expression. Q-RT-PCR analysis of gene expression presented as percent of fasting expression. Data presented is average of multiple experiments, for each virus and feeding condition: fasted (N=12), 2hr refed (N=4), 4hr refed (N=12), 9hr refed (N=4), 24hr refed (N=7). All data is presented as average +/- SEM. Significance determined by two-tailed unpaired Students T-Test * denotes P<0.05, ** P<0.01.
Figure 6
Figure 6. Hepatic Clk2 expression normalizes db/db diabetic phenotype
(A) Clk2 protein is down regulated in db/db mice. Western blot analysis of liver whole cell extracts from heterozygous control mice (Leprdb/+) or homozygous db/db mice (Leprdb/Leprdb) sacrificed during the feeding or 12hour fasted. (B) Pyruvate tolerance test from db/db or db/+ mice infected with GFP or Clk2 adenovirus. Mice were fasted overnight prior to intraperitioneal administration of 2g/Kg pyruvate. Data presented as average +/- SEM, db/db mice each line N=4, db/+ mice each line N=2. Significance indicated is determined between db/db GFP vs. db/db Clk2. (C) Q-RT-PCR analysis of gluconeogenic gene expression from total liver RNA from db/+ or db/db mice following an overnight fast. Data presented as average +/- SEM, db/db mice each bar N=4, db/+ mice each bar N=2. (D) Proposed model depicted regulation of Clk2 kinase activity, stability, and suppression of PGC-1α and gluconeogenesis. Significance determined by two-tailed unpaired Students T-Test * P<0.05, ** P<0.01.

Comment in

References

    1. Biddinger SB, Kahn CR. From mice to men: insights into the insulin resistance syndromes. Annual review of physiology. 2006;68:123–158. - PubMed
    1. Bullock AN, Das S, Debreczeni JE, Rellos P, Fedorov O, Niesen FH, Guo K, Papagrigoriou E, Amos AL, Cho S, et al. Kinase Domain Insertions Define Distinct Roles of CLK Kinases in SR Protein Phosphorylation. Structure. 2009;17:352–362. - PMC - PubMed
    1. Colwill K, Feng LL, Yeakley JM, Gish GD, Caceres JF, Pawson T, Fu XD. SRPK1 and Clk/Sty protein kinases show distinct substrate specificities for serine/arginine-rich splicing factors. The Journal of biological chemistry. 1996a;271:24569–24575. - PubMed
    1. Colwill K, Pawson T, Andrews B, Prasad J, Manley JL, Bell JC, Duncan PI. The Clk/Sty protein kinase phosphorylates SR splicing factors and regulates their intranuclear distribution. The EMBO journal. 1996b;15:265–275. - PMC - PubMed
    1. Dentin R, Liu Y, Koo SH, Hedrick S, Vargas T, Heredia J, Yates J, 3rd, Montminy M. Insulin modulates gluconeogenesis by inhibition of the coactivator TORC2. Nature. 2007;449:366–369. - PubMed

Publication types

MeSH terms

Substances