. 2010 Jan;11(1):58-69.
doi: 10.1016/j.cmet.2009.11.009.

Sarcolemmal ATP-sensitive K(+) channels control energy expenditure determining body weight

Affiliations

Sarcolemmal ATP-sensitive K(+) channels control energy expenditure determining body weight

Alexey E Alekseev et al. Cell Metab. 2010 Jan.

Abstract

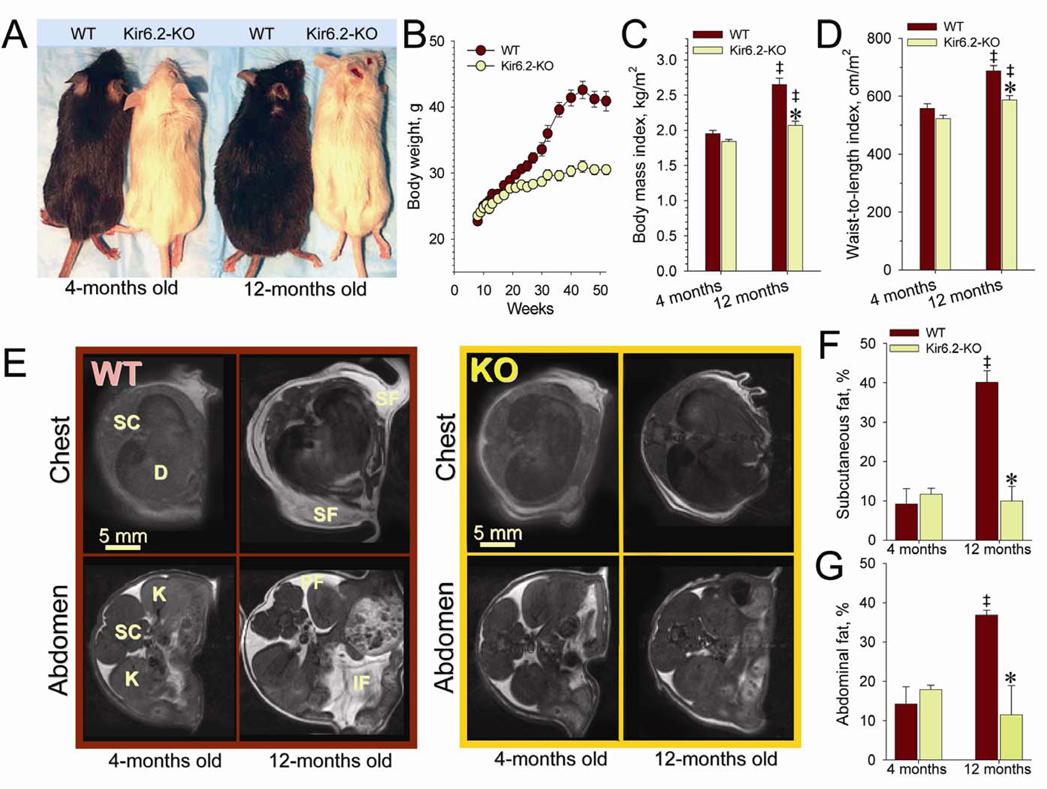
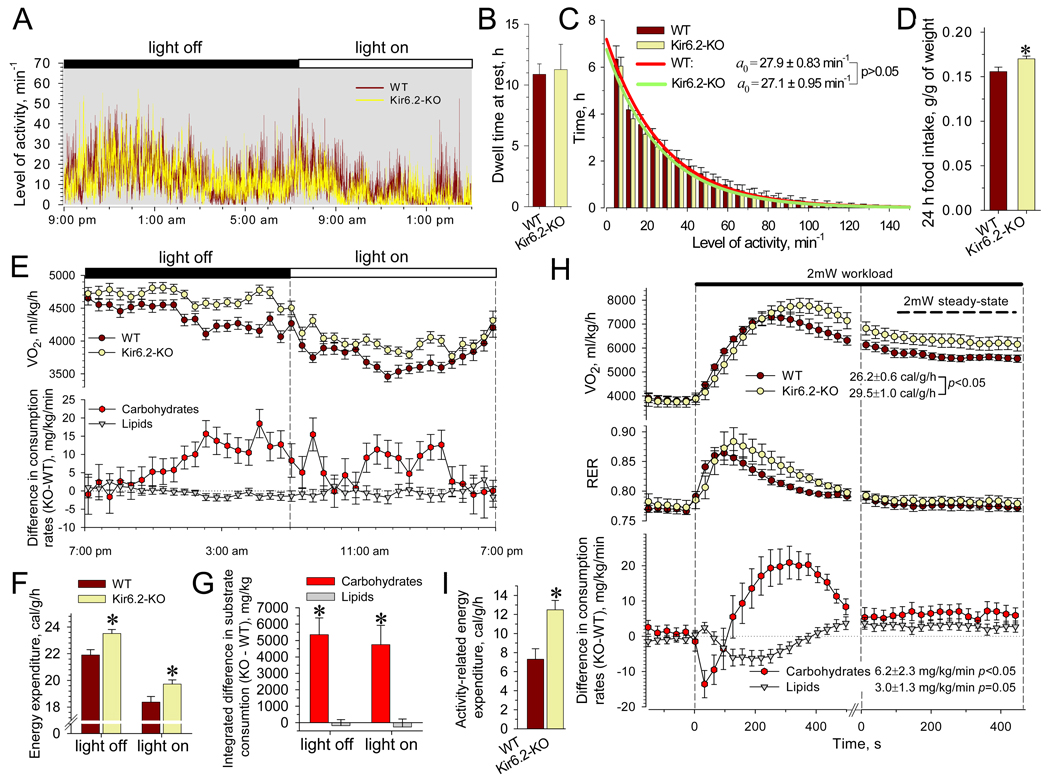
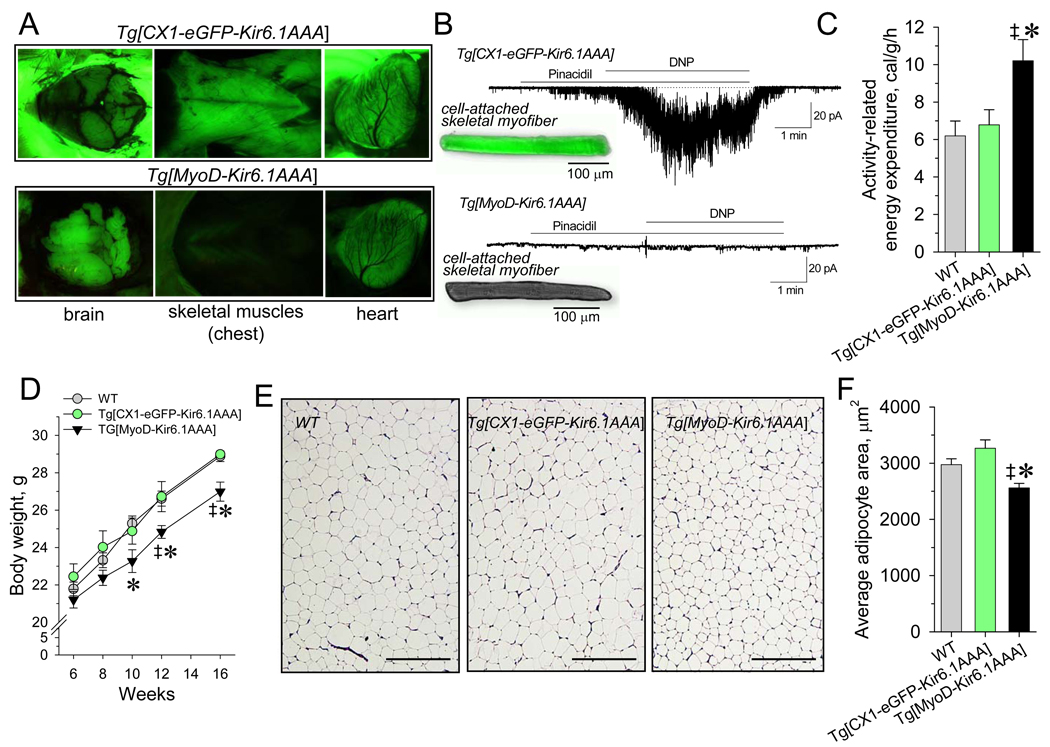
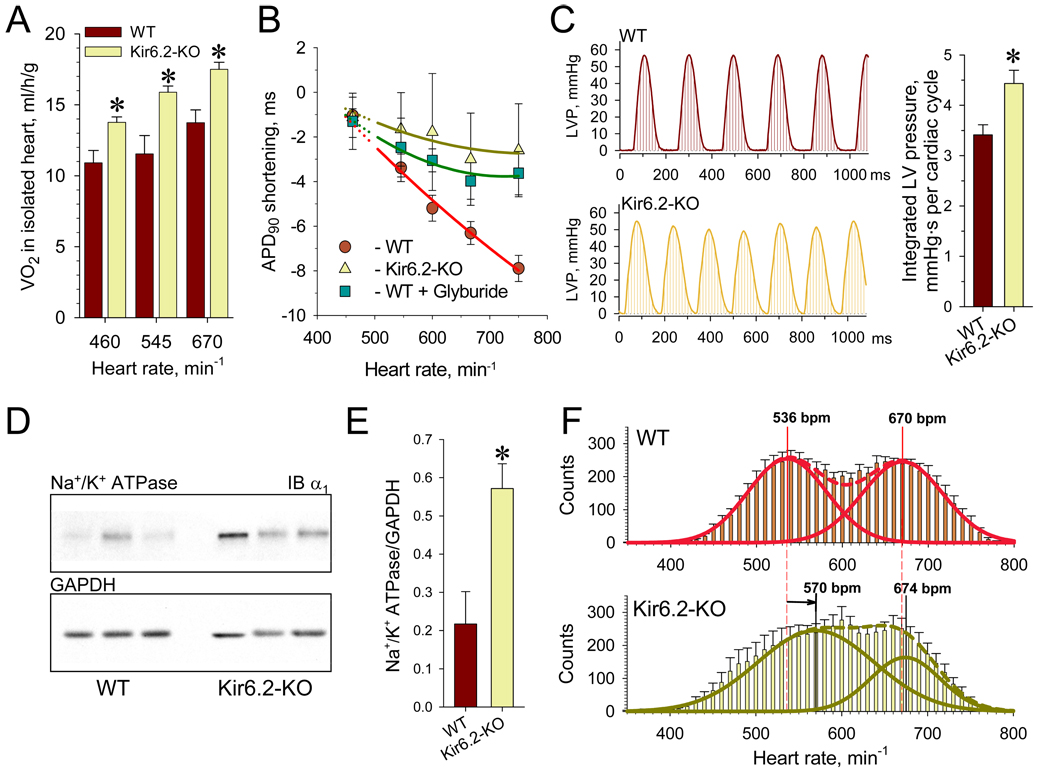
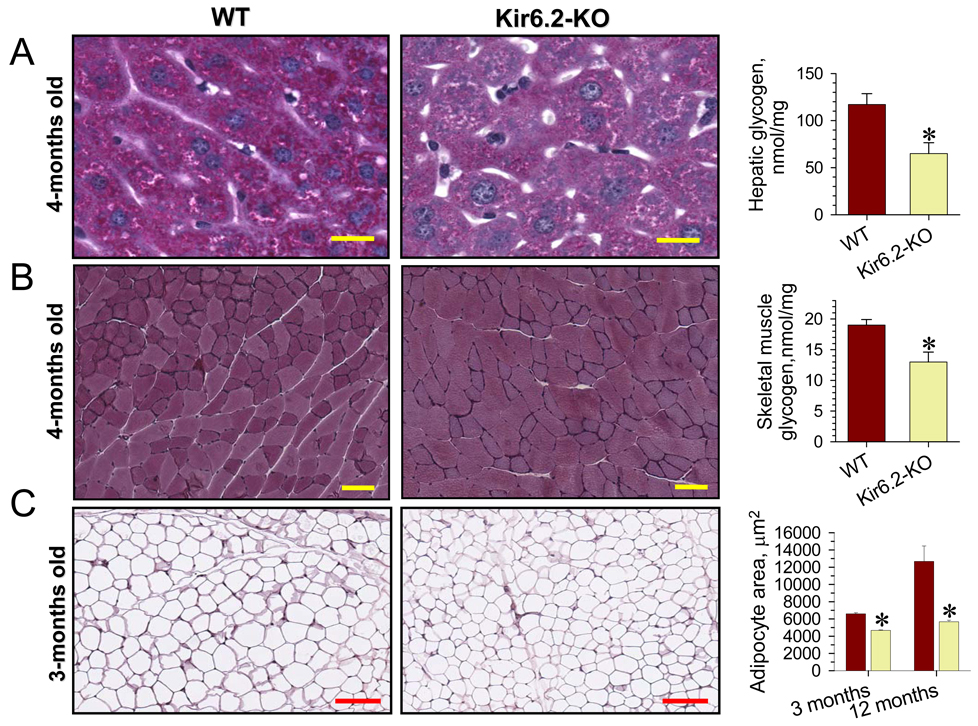
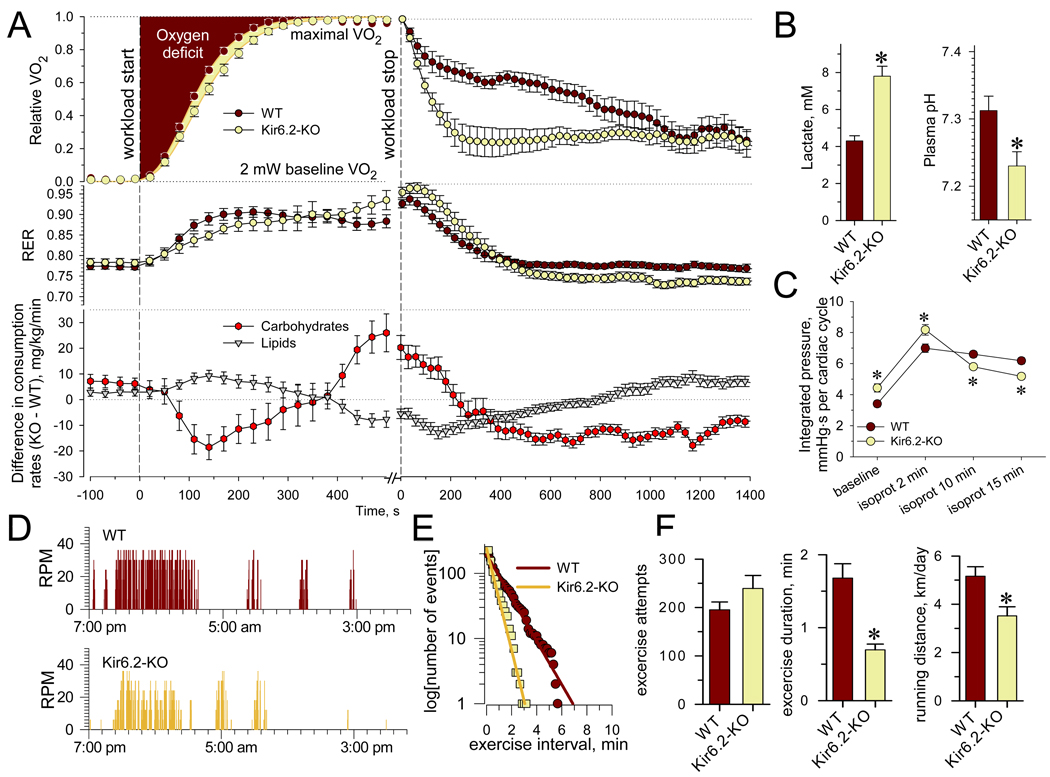
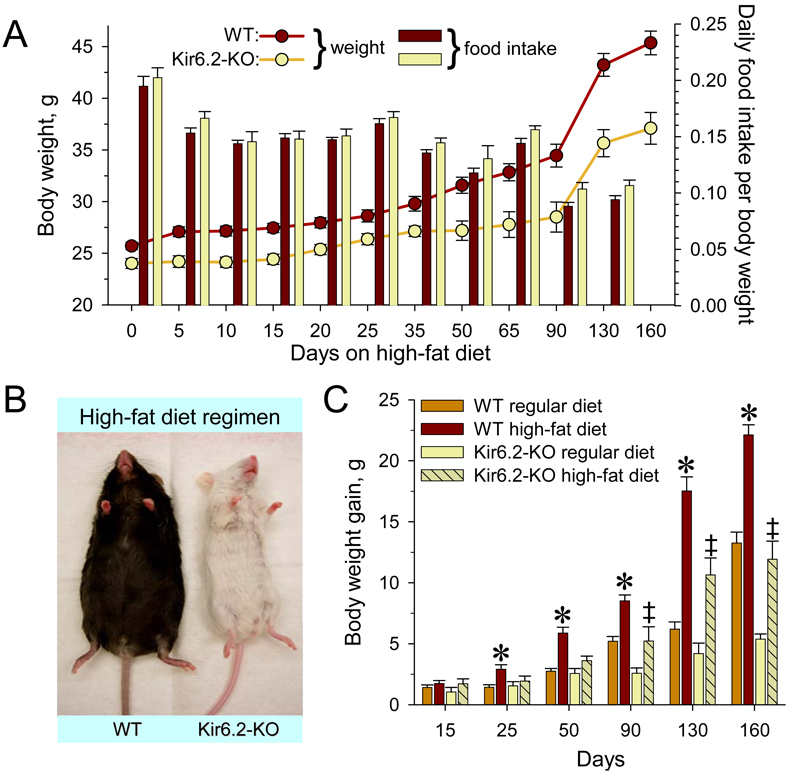
Metabolic processes that regulate muscle energy use are major determinants of bodily energy balance. Here, we find that sarcolemmal ATP-sensitive K(+) (K(ATP)) channels, which couple membrane excitability with cellular metabolic pathways, set muscle energy expenditure under physiological stimuli. Disruption of K(ATP) channel function provoked, under conditions of unaltered locomotor activity and blood substrate availability, an extra energy cost of cardiac and skeletal muscle performance. Inefficient fuel metabolism in K(ATP) channel-deficient striated muscles reduced glycogen and fat body depots, promoting a lean phenotype. The propensity to lesser body weight imposed by K(ATP) channel deficit persisted under a high-fat diet, yet obesity restriction was achieved at the cost of compromised physical endurance. Thus, sarcolemmal K(ATP) channels govern muscle energy economy, and their downregulation in a tissue-specific manner could present an antiobesity strategy by rendering muscle increasingly thermogenic at rest and less fuel efficient during exercise.


Figures

Figure 1
Figure 1. Kir6.2-KO mice inherit low body weight
(A) WT display larger trunk size compared to Kir6.2-KO at 1-year follow up. (B) Divergence in body weight in individually caged WT (n=10) and Kir6.2-KO (n=10) by 5 months of age. (C and D) Body mass index (BMI) calculated as the ratio of body weight to the square of body nasal-to-anal length, and waist-to-length index (WLI) calculated as the ratio of abdomen diameter to the square of body nasal-to-anal length, increased during maturation of WT and Kir6.2-KO (‡, p<0.05 at 12 versus 4-months within each cohort; n=10 in each group), with BMI and WLI significantly lower at 12 months in Kir6.2-KO compared to WT (*, p<0.05; n=10 in each group). (E) Transverse MRI scans through thorax and abdomen of WT (left) and Kir6.2-KO (right) at 4 and 12 months. Abbreviations: D, diaphragm; IF, interstitial fat; K, kidney; PF, retroperitoneal fat; SC, spinal cord; SF, subcutaneous fat. Note prominent fat deposition in WT compared to Kir6.2-KO at 1-year of age. (F and G) Mean areas of subcutaneous and abdominal fat, expressed relative to total cross-sectional area, were significantly increased in 12-months old WT compared to either 4-month-old WT (‡, p<0.05; n=4) or 12-month-old Kir6.2-KO (*, p<0.05; n=4). In contrast to WT, fat stores in Kir6.2-KO were statistically indistinguishable at both ages. Data are mean±SEM.
Figure 2
Figure 2. Activity, food intake and EE in WT and Kir6.2-KO
(A) Records of continuous locomotive activity monitored using implanted transmitting devices. (B and C) Dwell time spent without movement was indistinguishable between WT and Kir6.2-KO (n=8 for each group). Fitting of the activity distributions, solid curves, revealed mean characteristic activities indistinguishable between WT and Kir6.2-KO. (D) Food intake with regular chow diet, accumulated over 24 h and corrected for body weight, was higher in Kir6.2-KO (n=14) versus WT (n=16). (E) Average time-course of oxygen consumption rates (V̇O2), and difference of substrate consumption rate calculated for Kir6.2-KO (n=19) relative to WT (n=17). Data points represent the average of 3 measurements from each animal. (F) EE calculated based on V̇O2 and V̇CO2 values and averaged separately for light-on and light-off periods was higher in Kir6.2-KO versus WT. (G) Cumulative substrate utilization obtained by integration over light-on and light-off periods revealed elevated carbohydrate consumption in Kir6.-KO compared to WT. Lipid utilization remained equivalent. (H) V̇O2, respiratory exchange ratio (RER) and substrate consumption rates in WT (n=8) and Kir6.2-KO (n=8) were obtained within 30 s intervals during 2 mW treadmill test. At steady-state, Kir6.2-KO displayed an elevated EE compared to WT, accompanied with raised rates of substrate utilization. (I) Activity-related EE was higher in Kir6.2-KO versus WT (n=8 in each group). Data are mean±SEM; *, p<0.05.
Figure 3
Figure 3. Elevated EE decreases body weight in Tg[MyoD-Kir6.1AAA]
(A) Brain and muscle tissues of Tg[CX1-eGFP-Kir6.1AAA] and Tg[MyoD-Kir6.1AAA] mice exposed to 525 nm wavelength light. Tg[MyoD-Kir6.1AAA], due to Cre-recombination of eGFP-coding region, lacked eGFP fluorescence exclusively in skeletal muscles. (B) Expression of Kir6. 1AAA suppressed KATP channel function in skeletal muscle cells from Tg[MyoD-Kir6. 1AAA] as assessed by electrophysiology with no KATP channel response to pinacidil (50 µM) and 2,4-dinitrophenol (DNP, 200 µM), which induced vigorous KATP channel activation in Tg[CX1-eGFP-Kir6.1AAA] myofibers. (C) Activity-related EE defined in 8 weeks old Tg[MyoD-Kir6.1AAA] (n=5) was significantly higher compared to FVB/N WT (‡, p<0.05; n=6) or Tg[CX1-eGFP-Kir6.1AAA] littermates (*, p<0.05; n=4). (D) Body weight in Tg[MyoD-Kir6.1AAA] (n=6) was reduced compare to Tg[CX1-eGFP-Kir6.1AAA] (n=5;*, p<0.05) and FVB/N WT (n=8; ‡, p<0.05) littermates. (E and F) Average cross-sectional area of individual adipocytes was reduced in Tg[MyoD-Kir6.1AAA] (n=3) compared to Tg[CX1-eGFP-Kir6.1AAA] (n=3;*, p<0.05) and FVB/N WT (n=3; ‡, p<0.05); scale bars, 200 µm.
Figure 4
Figure 4. Increased EE and mechanical function of Kir6.2-KO isolated hearts
(A) Rate of oxygen consumption, measured in isolated perfused hearts revealed a significantly elevated energy demand in Kir6.2-KO versus WT (n=5 for each group). (B) Pacing rates above 130 ms (460 beats/min) induced significant shortening of APD90 in WT (n=8) that was sensitive to the sulfonylurea glyburide (10 µM, n=4) but not in hearts from Kir6.2-KO (n=5). Solid lines were constructed as results of quadratic polynomial fitting of experimental data relative to APD90 at 150 ms pacing interval. (C)Integrated left ventricular pressure was defined for 3–4 s long periods and divided by number of cardiac cycles in unpaced Kir6.2-KO and WT hearts (n=7 for each group). (D and E) Overexpression of sarcolemmal Na+/K+ pumps in Kir6.2-KO compared to WT (n=3 for each group) revealed by Western blots. (F) Histograms summarizing heart rates during 24-h long monitoring using telemetry in WT (n=11, top) and Kir6.2-KO (n=10, bottom). Dotted lines represent the fit of distributions with the sum of two Gaussian functions; solid lines indicate individual functions. Arrow indicates right shift of the lower mean heart rate in Kir6.2-KO relative to the corresponding value in WT. Data are mean±SEM;*, p<0.05.
Figure 5
Figure 5. Reduced energy depots in Kir6.2-KO
(A) Left: PAS histology of hepatic tissue indicates depletion of glycogen stores in liver from Kir6.2-KO compared to WT. Scale bar; 100 µm (40x image magnification). Right: biochemical evaluation confirmed liver glycogen deficit in Kir6.2-KO compared to WT n=9 in each group). (B) Left: PAS staining of skeletal muscle revealed significant depletion of glycogen in certain fibers from Kir6.2-KO gastrocnemius compared to WT. Scale bar: 200 µm (20x image magnification). Right: biochemical evaluation confirmed glycogen deficit in gastrocnemius from Kir6.2-KO (n=4) compared to WT (n=5). (C) Left: Adipose tissue histology in WT and Kir6.2-KO (scale bars, 200 µm). Right: Average cross-sectional area of individual adipocytes was increased in WT compared to Kir6.2-KO by 3 months of age, and the difference progressed by 12 months (n=3 for each group). Data are mean±SEM;*, p<0.05.
Figure 6
Figure 6. Reduced endurance and voluntary performance in Kir6.2-KO
(A) Relative VO2 (upper trace) and RER (middle trace) in WT (n=10) and Kir6.2-KO (n=11) were constructed during 30 mW treadmill workload and post-exercise recovery, respectively. The differences in KO versus WT in carbohydrate and lipid consumption rates are presented for corresponding time points (lower trace). Data points were acquired at 30 s intervals. (B) Plasma lactate and pH measured in blood samples taken immediately upon exhaustion from Kir6.2-KO (n=4) and WT (n=5). (C) In response to isoproterenol (10 µM), Kir6.2-KO hearts were not able to sustain the integrated LV pressure per cardiac cycle compared to WT hearts (n=7 in each group). (D) Representative recordings of voluntary performance during 24 h in WT and Kir6.2-KO housed in cages with attached running wheels. (E) Distributions of activity intervals were fitted by single exponential functions (lines on the semi-logarithmic scale). The higher exponential slope indicates a shortened mean exercise duration for Kir6.2-KO (0.56±0.02 min) versus WT (1.31±0.02 min). (F) Analysis of distributions for WT (n=10) and Kir6.2-KO (n=11) revealed similar number of voluntary exercise attempts (first bin), yet the mean exercise duration was double in WT compared to Kir6.2-KO. Accordingly, the running distance, defined based on wheel circumference and RPM, was compromised in Kir6.2-KO. Data are mean±SEM;*, p<0.05.
Figure 7
Figure 7. Resistance to high-fat diet induced obesity in Kir6.2-KO
(A) Under a high-fat diet regimen, Kir6.2-KO (n=10) gained less weight (left y-axis) than age- and gender-matched WT (n=10), despite comparable food consumption (right y-axis). (B) Representative WT and Kir6.2-KO after 90 days of high-fat diet regimen. (C) High-fat diet accelerated the rate of weight gain compared to regular chow diet in both WT and Kir6.2-KO, as determined by linear regression. However, the weight gain in WT was significantly higher compared to regular diet already at 25 days of the high fat regimen (*, p<0.05, n=10 for both groups), in contrast to 90 days for Kir6.2-KO (‡, p<0.05, n=10 in each group). Furthermore, the weight gained by Kir6.2-KO throughout the high-fat diet regimen was considerably lower compared to WT. Data are mean±SEM.

References

    1. Abraham MR, Selivanov VA, Hodgson D, Pucar D, Zingman LV, Wieringa B, Dzeja PP, Alekseev AE, Terzic A. Coupling of cell energetics with membrane metabolic sensing: Integrative signaling through creatine kinase phosphor-transfer disrupted by M-CK gene knockout. J. Biol. Chem. 2002;277:24427–24434. - PubMed
    1. Aguilar-Bryan L, Bryan J, Nakazaki M. Of mice and men: KATP channels and insulin secretion. Recent Prog. Horm. Res. 2001;56:47–68. - PubMed
    1. Alekseev AE, Hodgson DM, Karger AB, Park S, Zingman LV, Terzic A. ATP-sensitive K+ channel channel/enzyme multimer: metabolic gating in the heart. J. Mol. Cell. Cardiol. 2005;38:895–905. - PMC - PubMed
    1. Ashcroft FM. ATP-sensitive potassium channelopathies: focus on insulin secretion. J. Clin. Invest. 2005;115:2047–2058. - PMC - PubMed
    1. Babenko AP, Aguilar-Bryan L, Bryan J. A view of SUR/KIR6.X, KATP channels. Annu. Rev. Physiol. 1998;60:667–687. - PubMed

Publication types