

Irs1 serine 307 promotes insulin sensitivity in mice
- PMID: 20074531
- PMCID: PMC3314336
- DOI: 10.1016/j.cmet.2009.11.003
Irs1 serine 307 promotes insulin sensitivity in mice
Abstract
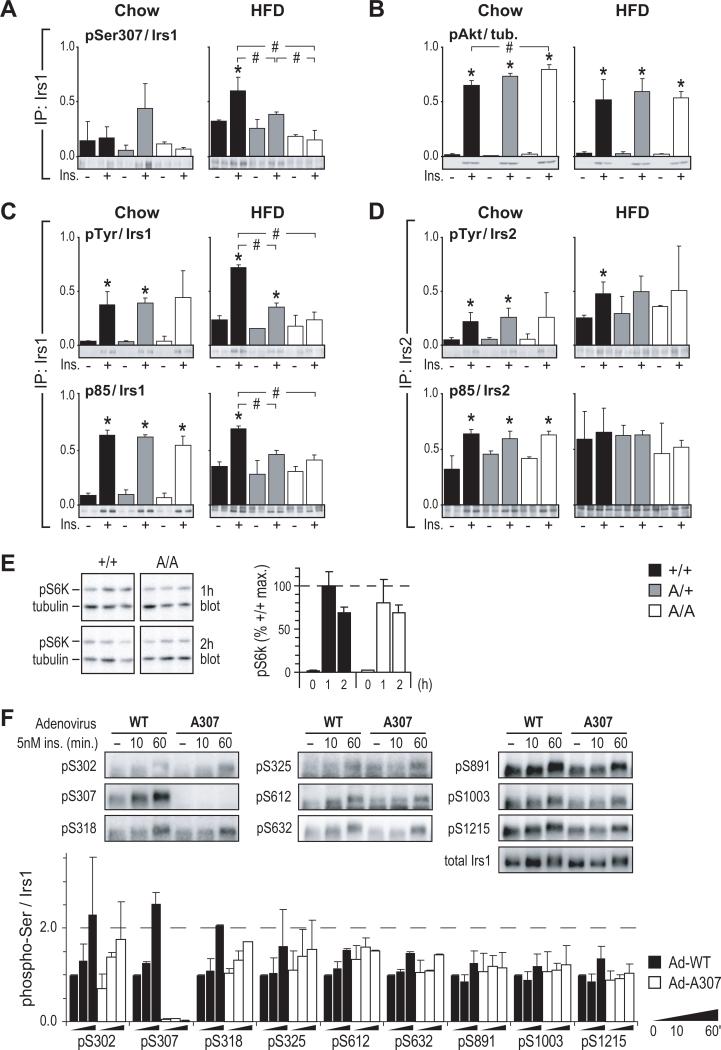
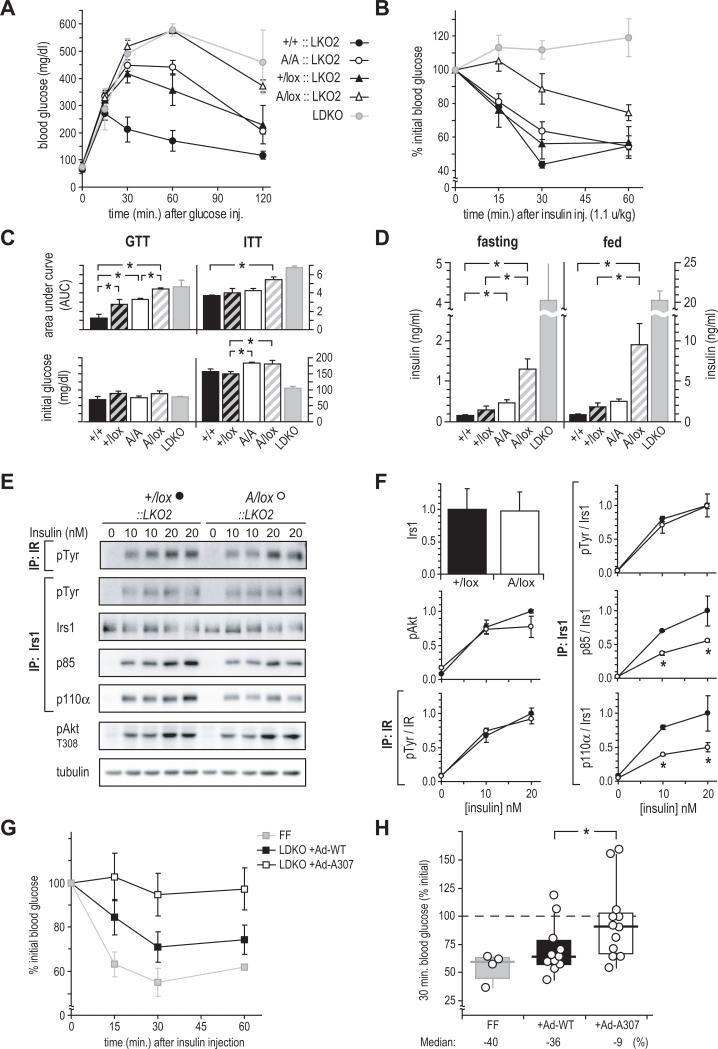
Phosphorylation of the insulin receptor substrates (Irs) on serine residues-typified by Ser307 of rodent Irs1-is thought to mediate insulin resistance. To determine whether Ser307 negatively regulates Irs1 in vivo, we generated knockin mice in which Ser307 (human Ser312) was replaced with alanine (A/A). Unexpectedly, A/A mice that were fed a high-fat diet developed more severe insulin resistance than control mice, accompanied by enhanced pancreatic compensation and impaired muscle insulin signaling. Chow-fed mice whose livers lacked Irs2 but retained a single knockin allele (A/lox::LKO2) were profoundly insulin resistant (versus +/lox::LKO2 mice), and their hepatocytes showed impaired insulin signaling ex vivo. Similarly, mutant A307 Irs1 adenovirus only partially restored the response to injected insulin in mice lacking hepatic Irs1 and Irs2. Thus, contrary to the results of cell-based experiments, Ser307 in mice is a positive regulatory site that moderates the severity of insulin resistance by maintaining proximal insulin signaling.
2010 Elsevier Inc.
Figures
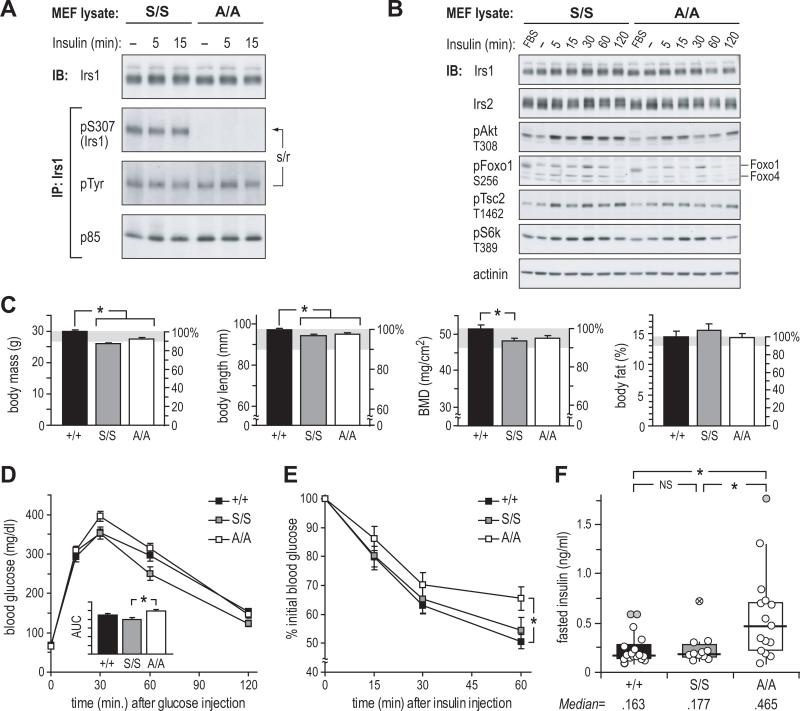
 and > 3×IQR:
  ) gave trimmed medians of 159 (+/+), 175 (S/S) and 404 pg/ml (A/A), yielding significance (p < 0.05) for the comparison of A/A vs. S/S insulin distributions. * = p < 0.05.
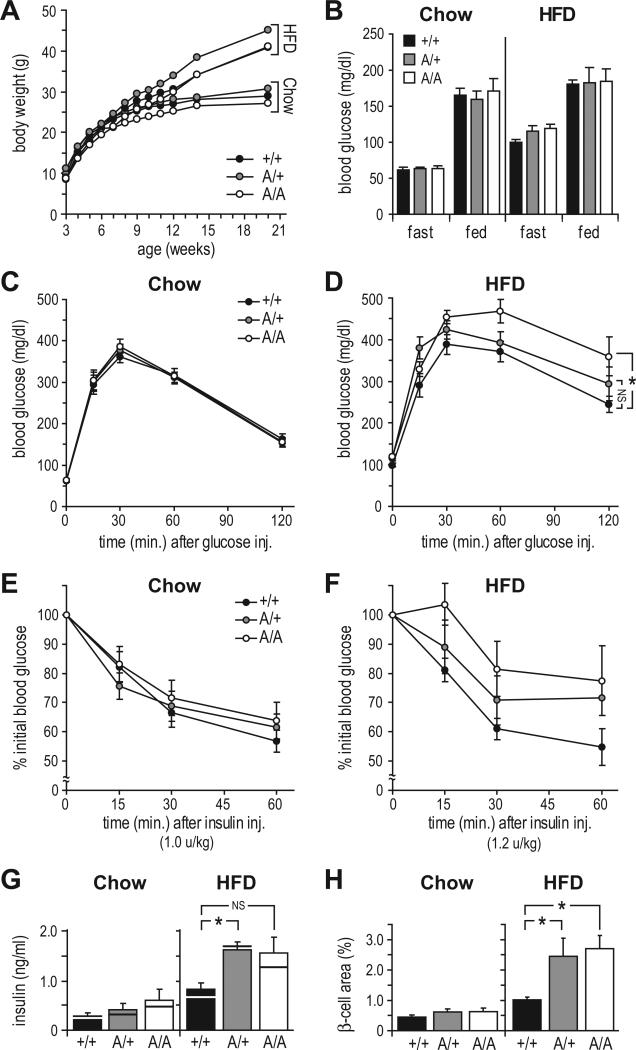
References
-
- Aguirre V, Uchida T, Yenush L, Davis R, White MF. The c-Jun NH(2)-terminal kinase promotes insulin resistance during association with insulin receptor substrate-1 and phosphorylation of Ser(307). J. Biol. Chem. 2000;275:9047–9054. - PubMed
-
- Giraud J, Haas M, Feener EP, Copps KD, Dong X, Dunn SL, White MF. Phosphorylation of Irs1 at SER-522 inhibits insulin signaling. Mol. Endocrinol. 2007;21:2294–2302. - PubMed
Publication types
MeSH terms
Substances
Grants and funding
LinkOut - more resources
Full Text Sources
Other Literature Sources
Medical
Molecular Biology Databases
