

Induced theta oscillations as biomarkers for alcoholism
- PMID: 20074999
- PMCID: PMC3246413
- DOI: 10.1016/j.clinph.2009.11.080
Induced theta oscillations as biomarkers for alcoholism
Abstract
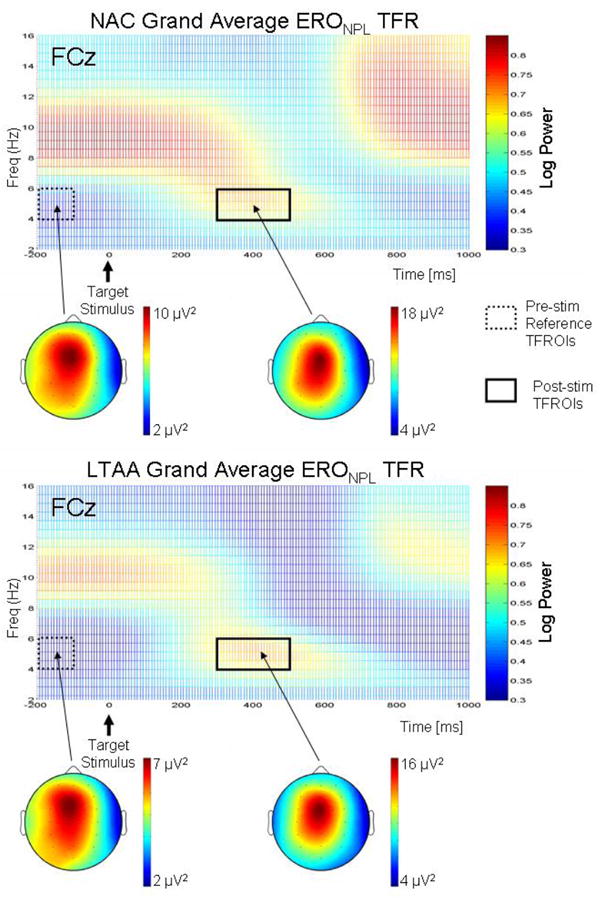
Objective: Studies have suggested that non-phase-locked event-related oscillations (ERO) in target stimulus processing might provide biomarkers of alcoholism. This study investigates the discriminatory power of non-phase-locked oscillations in a group of long-term abstinent alcoholics (LTAAs) and non-alcoholic controls (NACs).
Methods: EEGs were recorded from 48 LTAAs and 48 age and gender comparable NACs during rest with eyes open (EO) and during the performance of a three-condition visual target detection task. The data were analyzed to extract resting power, ERP amplitude and non-phase-locked ERO power measures. Data were analyzed using MANCOVA to determine the discriminatory power of induced theta ERO vs. resting theta power vs. P300 ERP measures in differentiating the LTAA and NAC groups.
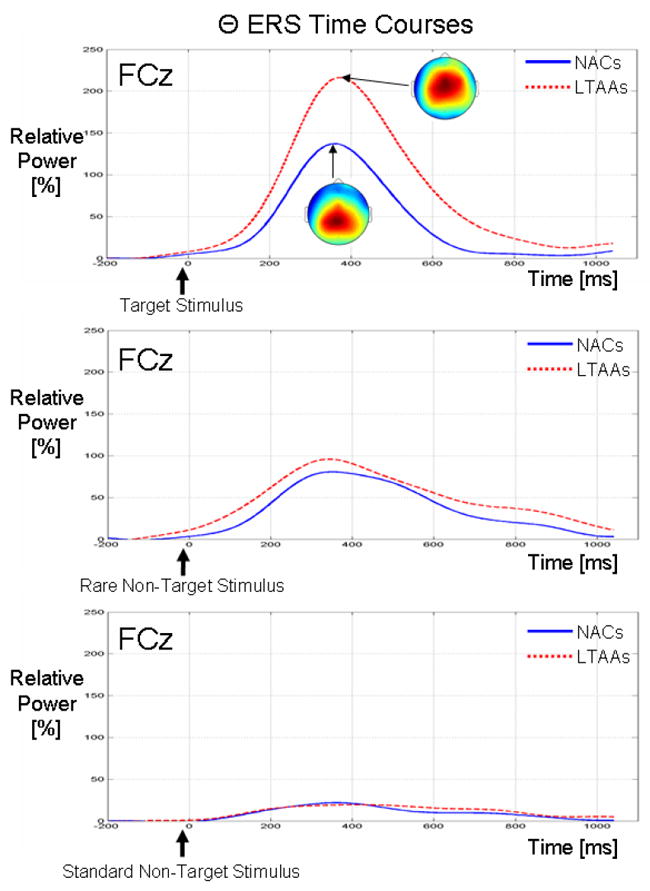
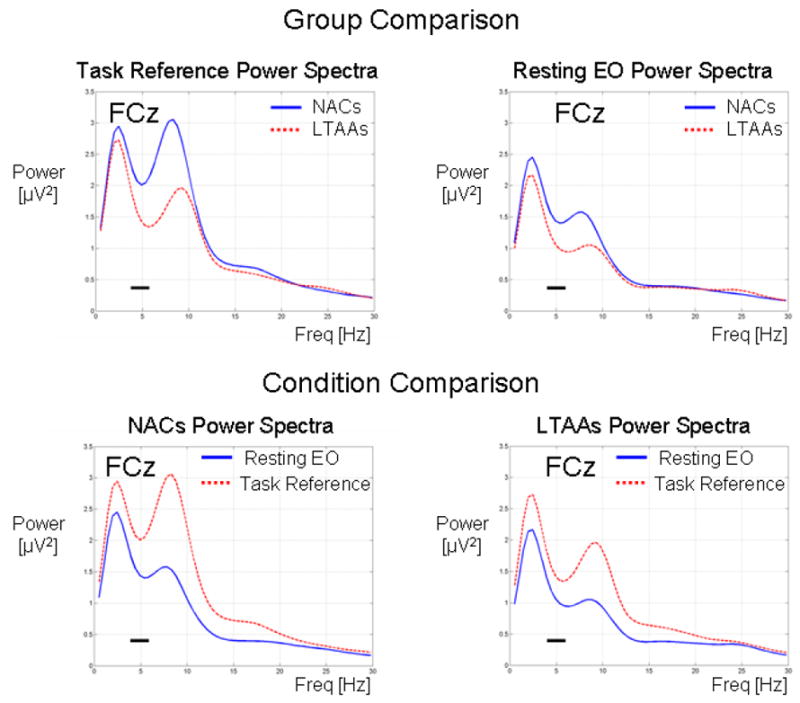
Results: Both groups showed significantly more theta power in the pre-stimulus reference period of the task vs. the resting EO condition. The resting theta power did not discriminate the groups, while the LTAAs showed significantly less pre-stimulus theta power vs. the NACs. The LTAAs showed a significantly larger theta event-related synchronization (ERS) to the target stimulus vs. the NACs, even after accounting for pre-stimulus theta power levels. ERS to non-target stimuli showed smaller induced oscillations vs. target stimuli with no group differences. Alcohol use variables, a family history of alcohol problems, and the duration of alcohol abstinence were not associated with any theta power measures.
Conclusions: While reference theta power in the task and induced theta oscillations to target stimuli both discriminate LTAAs and NACs, induced theta oscillations better discriminate the groups. Induced theta power measures are also more powerful and independent group discriminators than the P3b amplitude.
Significance: Induced frontal theta oscillations promise to provide biomarkers of alcoholism that complement the well-established P300 ERP discriminators.
Figures
Similar articles
-
Event-related oscillations versus event-related potentials in a P300 task as biomarkers for alcoholism.Alcohol Clin Exp Res. 2010 Apr;34(4):669-80. doi: 10.1111/j.1530-0277.2009.01136.x. Epub 2010 Jan 26. Alcohol Clin Exp Res. 2010. PMID: 20102573 Free PMC article.
-
Delta, theta, and alpha event-related oscillations in alcoholics during Go/NoGo task: Neurocognitive deficits in execution, inhibition, and attention processing.Prog Neuropsychopharmacol Biol Psychiatry. 2016 Feb 4;65:158-71. doi: 10.1016/j.pnpbp.2015.10.002. Epub 2015 Oct 9. Prog Neuropsychopharmacol Biol Psychiatry. 2016. PMID: 26456730 Free PMC article.
-
Visual P300s in long-term abstinent chronic alcoholics.Alcohol Clin Exp Res. 2006 Dec;30(12):2000-7. doi: 10.1111/j.1530-0277.2006.00246.x. Alcohol Clin Exp Res. 2006. PMID: 17117965 Free PMC article.
-
Brain oscillations as biomarkers in neuropsychiatric disorders: following an interactive panel discussion and synopsis.Suppl Clin Neurophysiol. 2013;62:343-63. doi: 10.1016/b978-0-7020-5307-8.00016-8. Suppl Clin Neurophysiol. 2013. PMID: 24053048 Review.
-
Uncovering genes for cognitive (dys)function and predisposition for alcoholism spectrum disorders: a review of human brain oscillations as effective endophenotypes.Brain Res. 2008 Oct 15;1235:153-71. doi: 10.1016/j.brainres.2008.06.053. Epub 2008 Jun 24. Brain Res. 2008. PMID: 18634760 Free PMC article. Review.
Cited by
-
Amyloid Beta Peptide slows down sensory-induced hippocampal oscillations.Int J Pept. 2012;2012:236289. doi: 10.1155/2012/236289. Epub 2012 Apr 29. Int J Pept. 2012. PMID: 22611415 Free PMC article.
-
Understanding alcohol use disorders with neuroelectrophysiology.Handb Clin Neurol. 2014;125:383-414. doi: 10.1016/B978-0-444-62619-6.00023-9. Handb Clin Neurol. 2014. PMID: 25307587 Free PMC article. Review.
-
Pattern recognition of spectral entropy features for detection of alcoholic and control visual ERP's in multichannel EEGs.Brain Inform. 2017 Jun;4(2):147-158. doi: 10.1007/s40708-017-0061-y. Epub 2017 Jan 21. Brain Inform. 2017. PMID: 28110475 Free PMC article.
-
Theta event-related synchronization is a biomarker for a morbid effect of alcoholism on the brain that may partially resolve with extended abstinence.Brain Behav. 2012 Nov;2(6):796-805. doi: 10.1002/brb3.95. Epub 2012 Oct 5. Brain Behav. 2012. PMID: 23170242 Free PMC article.
-
Neurophysiological correlate of incubation of craving in individuals with methamphetamine use disorder.Mol Psychiatry. 2021 Nov;26(11):6198-6208. doi: 10.1038/s41380-021-01252-5. Epub 2021 Aug 12. Mol Psychiatry. 2021. PMID: 34385601
References
-
- American Psychiatric Association. DSM-IV-TR: Diagnostic and Statistical Manual of Mental Disorders. 4. American Psychiatric Publishing; Washington, DC: 2000.
-
- Bastiaansen M, Hagoort P. Event-induced theta responses as a window on the dynamics of memory. Cortex. 2003;39:967–992. - PubMed
-
- Deiber M-P, Missonnier P, Bertrand O, Gold G, Fazio-Costa L, Ibanez V, et al. Distinction between Perceptual and Attentional Processing in Working Memory Tasks: A Study of Phase-locked and Induced Oscillatory Brain Dynamics. Journal of Cognitive Neuroscience. 2007;19:158–172. - PubMed
-
- Delorme A, Makeig S. EEGLAB: an open source toolbox for analysis of single-trial EEG dynamics including independent component analysis. J Neurosci Methods. 2004;134:9–21. - PubMed
Publication types
MeSH terms
Substances
Grants and funding
LinkOut - more resources
Full Text Sources
Medical
Miscellaneous
