Complexity and anisotropy in host morphology make populations less susceptible to epidemic outbreaks
- PMID: 20075039
- PMCID: PMC2880076
- DOI: 10.1098/rsif.2009.0475
Complexity and anisotropy in host morphology make populations less susceptible to epidemic outbreaks
Abstract
One of the challenges in epidemiology is to account for the complex morphological structure of hosts such as plant roots, crop fields, farms, cells, animal habitats and social networks, when the transmission of infection occurs between contiguous hosts. Morphological complexity brings an inherent heterogeneity in populations and affects the dynamics of pathogen spread in such systems. We have analysed the influence of realistically complex host morphology on the threshold for invasion and epidemic outbreak in an SIR (susceptible-infected-recovered) epidemiological model. We show that disorder expressed in the host morphology and anisotropy reduces the probability of epidemic outbreak and thus makes the system more resistant to epidemic outbreaks. We obtain general analytical estimates for minimally safe bounds for an invasion threshold and then illustrate their validity by considering an example of host data for branching hosts (salamander retinal ganglion cells). Several spatial arrangements of hosts with different degrees of heterogeneity have been considered in order to separately analyse the role of shape complexity and anisotropy in the host population. The estimates for invasion threshold are linked to morphological characteristics of the hosts that can be used for determining the threshold for invasion in practical applications.
Figures


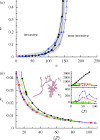
 , for heterogeneous systems with different lattice spacings a (marked by different symbols) and for a mean-field system with homogeneous transmissibility
  (dashed line). The bond-percolation critical probability, pc, marked by the arrow gives the invasion threshold in the thermodynamic limit. The inset shows the invasion probability as a function of the infection efficiency k for different values of lattice spacing marked by the same symbols as in the main figure. Circle, a = 20; asterisk, a = 40; square, a = 60; triangle, a = 80; diamond, a = 100.
 (solid symbols) and
  (open symbols) for arrangements of type 3. (b) Invasion threshold kc as a function of the average overlap
  for arrangements of type 1 (circles), type 2 with orientation ϕ = 0 (diamonds) and type 3 with mean orientation
  and two widths of uniform distribution,
  (solid squares) and
  (open squares). The branching host used as a motif for arrangements of type 2 and 3 is displayed in the figure. The dashed line represents the dependence of kc0 versus
  given by equation (3.2). The insets show the dispersions V1 and V2 of the overlaps associated with the disorder and anisotropy, respectively, corresponding to the same arrangements as in the main figure (the symbol code is the same as in the main figure).
 . The critical infection efficiency
  corresponding to a configuration with lattice spacing a and orientation ϕ is given by the value of k related to the critical surface containing the configuration point
  .
.
 , on the SLAD, d2, for all the branching hosts in arrangements of type 2. Different symbols refer to different values of k and each point for a particular symbol corresponds to an individual branching host. The solid lines represent the linear regression fit for each value of k (e.g. ac(k) = 14.1 + 0.94d2 with correlation coefficient ≃ 0.97 for k = 1). The inset defines graphically the LADs {d1, d2, d3}. Circle, k = 0.1; square, k = 1; triangle, k = 10.
References
-
- Cox J. T., Durrett R. 1988. Limit theorems for the spread of epidemics and forest fires. Stoch. Proc. Appl. 30, 171–191. (10.1016/0304-4149(88)90083-X) - DOI
Publication types
MeSH terms
Grants and funding
LinkOut - more resources
Full Text Sources

