. 2010 Feb;21(2):303-15.
doi: 10.1681/ASN.2009070728. Epub 2010 Jan 14.

Phosphoproteomic profiling reveals vasopressin-regulated phosphorylation sites in collecting duct

Affiliations

Phosphoproteomic profiling reveals vasopressin-regulated phosphorylation sites in collecting duct

Amar D Bansal et al. J Am Soc Nephrol. 2010 Feb.

Abstract

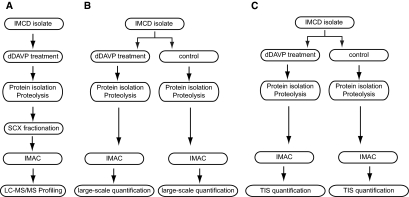
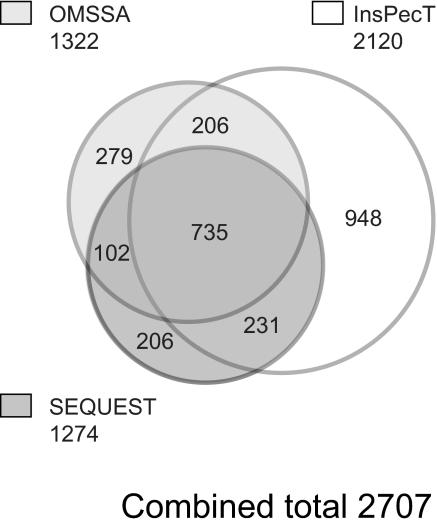
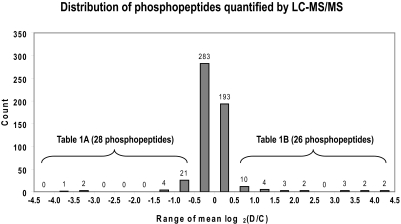
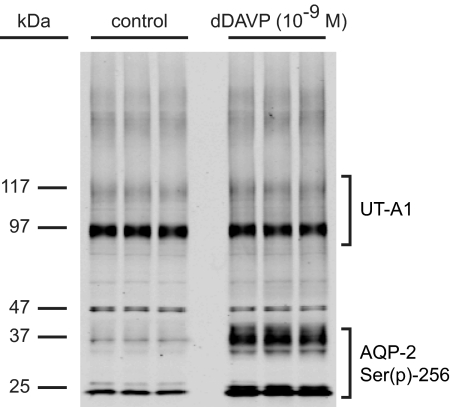
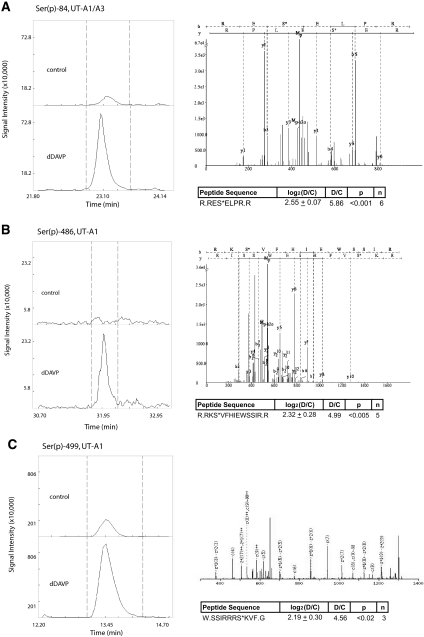
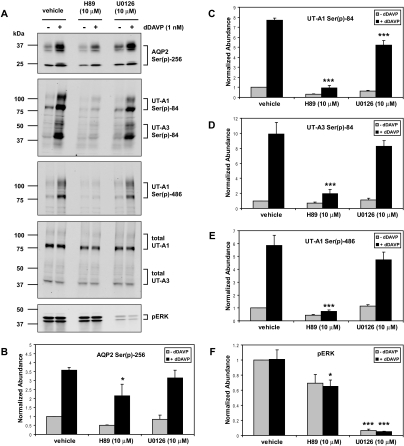
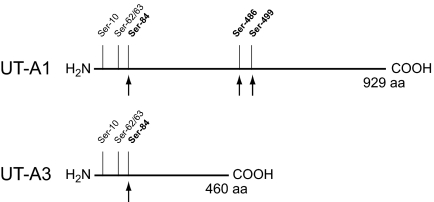
Protein phosphorylation is an important component of vasopressin signaling in the renal collecting duct, but the database of known phosphoproteins is incomplete. We used tandem mass spectrometry to identify vasopressin-regulated phosphorylation events in isolated rat inner medullary collecting duct (IMCD) suspensions. Using multiple search algorithms to identify the phosphopeptides from spectral data, we expanded the size of the existing collecting duct phosphoproteome database from 367 to 1187 entries. Label-free quantification in vasopressin- and vehicle-treated samples detected a significant change in the phosphorylation of 29 of 530 quantified phosphopeptides. The targets include important structural, regulatory, and transporter proteins. The vasopressin-regulated sites included two known sites (Ser-486 and Ser-499) present in the urea channel UT-A1 and one previously unknown site (Ser-84) on vasopressin-sensitive urea channels UT-A1 and UT-A3. In vitro assays using synthetic peptides showed that purified protein kinase A (PKA) could phosphorylate all three sites, and immunoblotting confirmed the PKA dependence of Ser-84 and Ser-486 phosphorylation. These results expand the known list of collecting duct phosphoproteins and highlight the utility of targeted phosphoproteomic approaches.


Figures

Figure 1.
Figure 1.
The three different LC-MS/MS experiments performed are as follows: (A) The initial phosphoproteomic profiling experiment consisted of a single dDAVP-treated sample that was processed using SCX fractionation. (B) The second experiment was performed for large-scale quantification using a nonselective “profiling” mode. (C) The third experiment was performed for targeted quantification by selection of precursor ion m/z ratios, so-called targeted ion selection (TIS) mode.
Figure 2.
Figure 2.
Venn diagram shows the number of unique phosphopeptide identifications that resulted from each of three search algorithms (SEQUEST, InsPecT, and OMSSA). A false-discovery rate stringency of <2% was used for each of the searches.
Figure 3.
Figure 3.
Immunoblot showing that dDAVP increased phosphorylation of Ser-256 of AQP2. An immunoblot of IMCD protein isolate shows five pairs of control and dDAVP-treated samples. Bands at 29 and 37 kDa indicate Ser(p)-256 bands (nonglycosylated and glycosylated forms, respectively).
Figure 4.
Figure 4.
Histogram showing distribution of the mean log2(D/C) for all peptides quantified using LC-MS/MS. The vast majority of peptides did not change with dDAVP treatment (476 (90.0%) of 530), having mean log2(D/C) values between −0.58 and 0.58.
Figure 5.
Figure 5.
dDAVP increases β-catenin phosphorylation in rat IMCD. (A) Top panel: Immunoblot of IMCD suspensions showing five pairs of control and dDAVP-treated samples. Band at 97 kDa is Ser(p)-552-β-catenin. dDAVP causes increased phosphorylation of Ser-552 of β-catenin. Bottom panel: Immunoblot of IMCD suspensions showing the same five pairs of control and dDAVP-treated samples using antibody recognizing total β-catenin. (B) Top panel: Immunoblot of whole inner medulla from Brattleboro rats showing increased Ser(p)-552-β-catenin in response to dDAVP given intramuscularly. Bottom panel: Immunoblot of whole inner medulla from Brattleboro rats showing that there is no increase in total β-catenin abundance in response to dDAVP given intramuscularly.
Figure 6.
Figure 6.
Immunoblot shows that dDAVP treatment of IMCD does not result in increased total protein abundance of UT-A1. Immunoblot shows three pairs of control and dDAVP-treated samples. Proteins at 29 and 37 kDa are Ser(p)-256-AQP2 (nonglycosylated and glycosylated forms, respectively). Protein at 97 and 117 kDa is UT-A1.
Figure 7.
Figure 7.
MS quantification of UT-A phosphorylation is illustrated by reconstructed peptide ion chromatograms from QUOIL software. The data show an increase in peak areas with dDAVP treatment compared with control for (A) Ser(p)-84 on both UT-A1 and UT-A3, (B) Ser(p)-486 on UT-A1, and (C) Ser(p)-499 on UT-A1. Also shown in each subfigure are mean and SE values for all quantifications along with a representative MS2 spectrum for the identified peptide.
Figure 8.
Figure 8.
PKA can phosphorylate Ser-84 (UT-A1 and UT-A3), Ser-486-UT-A1, and Ser-499-UT-A1 in vitro. In each of the windows, the top half shows the reconstructed ion chromatogram for the phosphopeptide when PKA was not present in the reaction mixture; the bottom half shows the corresponding profiles for the phosphopeptide when PKA was added to the reaction mixture. (A) The C-terminal tail of AQP-2, which served as a positive control, is phosphorylated by PKA on Ser-256. Phosphorylation occurred only in the presence of kinase for (B) Ser-486-UT-A1, (C) Ser-84 (UT-A1 and UT-A3), and (D) Ser-499-UT-A1.
Figure 9.
Figure 9.
Phosphorylation of both UT-A1 and UT-A3 is blocked by an inhibitor of PKA. (A) Rat IMCD samples were treated with either vehicle, the PKA inhibitor H89, or the MEK inhibitor U0126 for 10 minutes, followed by incubation with dDAVP for 20 minutes, followed by immunoblotting with antibodies to AQP2 Ser(p)-256, UT-A1 and UT-A3 Ser(p)-84, UT-A1 Ser(p)-486, total UT-A1 and UT-A3, and pERK. (B to F) Quantification of band densities from these immunoblots as well as other trials (n = 3; *P < 0.05 versus vehicle; ***P < 0.001 versus vehicle).
Figure 10.
Figure 10.
Schematic of the two urea channels (UT-A1 and UT-A3) expressed in IMCD with the relative position of phosphorylation sites identified and quantified by LC-MS/MS. Sites marked with an arrow were found to be phosphorylated in response to vasopressin.

Similar articles

Cited by

References

    1. Nielsen S, Frokiaer J, Marples D, Kwon TH, Agre P, Knepper MA: Aquaporins in the kidney: From molecules to medicine. Physiol Rev 82: 205–244, 2002 - PubMed
    1. Brown D: The ins and outs of aquaporin-2 trafficking. Am J Physiol Renal Physiol 284: F893–F901, 2003 - PubMed
    1. Uawithya P, Pisitkun T, Ruttenberg BE, Knepper MA: Transcriptional profiling of native inner medullary collecting duct cells from rat kidney. Physiol Genomics 32: 229–253, 2008 - PMC - PubMed
    1. Yano Y, Rodrigues AC, Jr., de Braganca AC, Andrade LC, Magaldi AJ: PKC stimulated by glucagon decreases UT-A1 urea transporter expression in rat IMCD. Pflugers Arch 456: 1229–1237, 2008 - PubMed
    1. O'Connor PM, Cowley AW, Jr.: Vasopressin-induced nitric oxide production in rat inner medullary collecting duct is dependent on V2 receptor activation of the phosphoinositide pathway. Am J Physiol Renal Physiol 293: F526–F532, 2007 - PubMed

Publication types

LinkOut - more resources