. 2010 Apr 2;285(14):10408-14.
doi: 10.1074/jbc.M109.085787. Epub 2010 Jan 14.

Cross-talk between mitochondrial malate dehydrogenase and the cytochrome bc1 complex

Affiliations

Cross-talk between mitochondrial malate dehydrogenase and the cytochrome bc1 complex

Qiyu Wang et al. J Biol Chem. .

Abstract

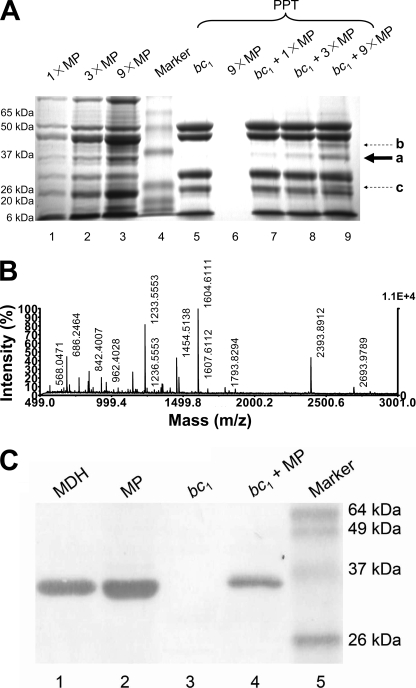
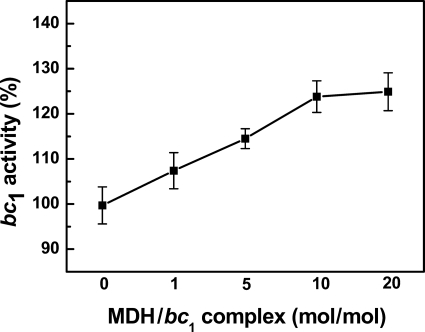
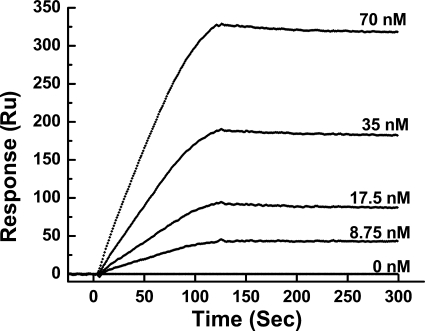
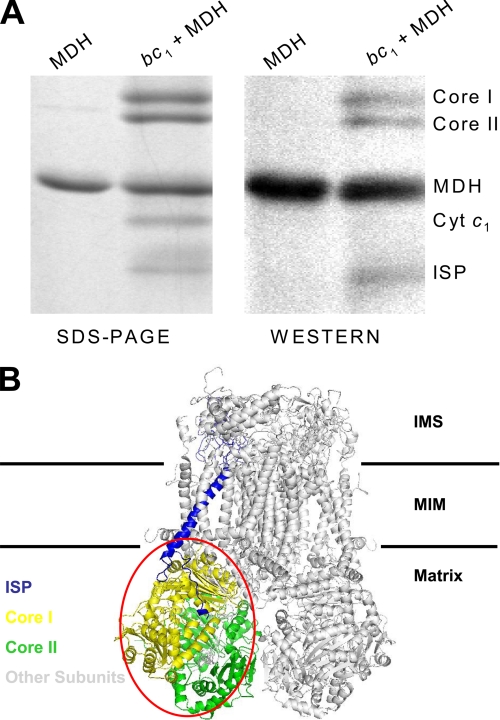
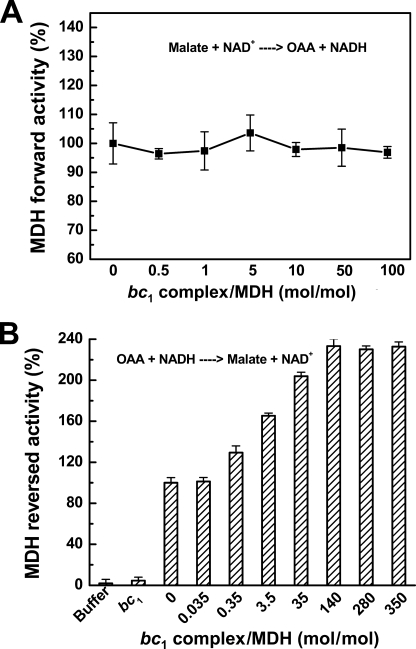
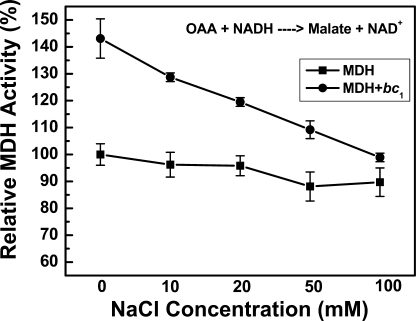
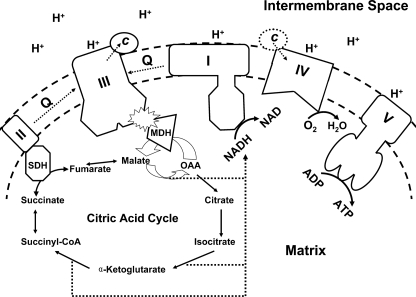
The interactions between the mitochondrial cytochrome bc(1) complex and matrix-soluble proteins were studied by a precipitation pulldown technique. Purified, detergent-dispersed bc(1) complex was incubated with mitochondrial matrix proteins followed by dialysis in the absence of detergent. The interacting protein(s) was co-precipitated with bc(1) complex upon centrifugation. One of the matrix proteins pulled down by bc(1) complex was identified as mitochondrial malate dehydrogenase (MDH) by matrix-assisted laser desorption ionization time-of-flight mass spectrometry and confirmed by Western blotting with anti-MDH antibody. Using a cross-linking technique, subunits I, II (core I and II), and V of the bc(1) complex were identified as the interacting sites for MDH. Incubating purified MDH with the detergent dispersed bc(1) complex results in an increase of the activities of both the bc(1) complex and MDH. The effect of the bc(1) complex on the activities of MDH is unidirectional (oxaloacetate --> malate). These results suggest that the novel cross-talk between citric acid cycle enzymes and electron transfer chain complexes might play a regulatory role in mitochondrial bioenergetics.


Figures

FIGURE 1.
FIGURE 1.
Identification of MDH as an interacting protein with the bc1 complex. A, SDS-PAGE analysis of bc1 pulled-down proteins from matrix extract. Lanes 1-3, various amounts of MP as controls show the proteins in the matrix extract; lane 4, standard proteins; lanes 5 and 6, bc1 complex and MP only as controls show the precipitates after centrifugation; lanes 7-9, shown is the bc1 complex together with the pulled-down proteins from matrix extract. The solid arrow shows the main matrix protein being pulled down by the bc1 complex. The dashed arrow shows some other bands being pulled down by the bc1 complex. MP stands for mitochondrial matrix proteins; 1×, 3×, and 9× stand for 0.28, 0.83, and 2.50 mg/ml of MP in the experiment. PPT stands for precipitates. a, malate dehydrogenase; b, aspartate transaminase; c, unknown protein. B, shown are mass spectrometry spectra of protein sliced from SDS-PAGE gel. Spectrum data were collected from a MALDI-TOF mass spectrometer. It consisted of a series of multiple charged ions from each fragment on a mass-to-charge (m/z) ratio scale. 100% intensity represents the highest peak. C, shown is a Western blot analysis of bc1 pulldown matrix proteins with anti-MDH antibody. Lane 1, purified bovine mitochondrial MDH; lane 2, mitochondrial matrix extract (MP); lane 3, bc1; lane 4, the precipitate from dialyzed mixture of the bc1 complex and mitochondrial matrix extract (bc1+MP); lane 5, standard proteins.
FIGURE 2.
FIGURE 2.
Effect of MDH concentration on the bc1 complex activity. A given amount of bc1 complex was added to different amounts of MDH to give the indicated molar ratios. After the mixtures were incubated on ice for 20 min, the bc1 activity was determined. The activity of bc1 complex only was used as 100%. n = 3, data are the means ± S.E.
FIGURE 3.
FIGURE 3.
Surface plasmon resonance analysis of the interaction between bc1 complex and MDH. The bc1 complex was diluted with the flowing buffer to give concentrations of 8.75, 17.5, 35, and 70 nm. The flowing buffer used was 100 mm Na+/K+ phosphate buffer, pH 7.4, containing 0.01% potassium deoxycholate. Aliquots of 100 μl of diluted bc1 at the indicated concentrations were injected into both the control channel and MDH-bound channel. The flow rate was held constant at 50 μl/min response units (Ru). Data were analyzed with Qdat software.
FIGURE 4.
FIGURE 4.
SDS-PAGE and Western blotting of sulfo-SBED cross-linked MDH and bc1. A, 10 μg of MDH in 100 μl of 50 mm Na+/K+ phosphate buffer, pH 7.4, was incubated with sulfo-SBED for 2 h on ice in the dark then dialyzed against 500 ml of a 50 mm Na+/K+ phosphate buffer, pH 7.4, in the dark to remove any unreacted sulfo-SBED. The chemically labeled MDH was then incubated without and with 30 μg of bc1 in 200 μl of a 50 mm Na+/K+ phosphate buffer, pH 7.4, on ice for 1 h. After incubation, the mixtures were photolyzed with a long wavelength UV light (365 nm) at a distance of 5 cm for 15 min. The photolyzed samples were treated with β-mercaptoethanol and subjected to SDS-PAGE and Western blotting. The biotin tags were probed with an avidin-horseradish peroxidase conjugate. B, the interaction partners for MDH were shown in the three-dimensional structure of the bc1 complex. Protein Data Bank code 1NTM. IMS, intermembrane space; MIM, mitochondrial inner membrane.
FIGURE 5.
FIGURE 5.
Effect of bc1 complex on the activity of forward reaction (from malate to oxaloacetate) and reversed reaction (from oxaloacetate to malate) of MDH. Varying amounts of bc1 complexes were incubated on ice for 20 min with a given amount of MDH to give the indicated molar ratios. The mixtures were then subjected to assay for MDH forward (A) and reversed (B) activities. The activity of MDH in the absence of bc1 was used as 100%. n = 3, data are the means ± S.E.
FIGURE 6.
FIGURE 6.
Effect of ionic strength on reverse MDH activity enhancement by bc1. MDH only or together with bc1 complex in 100 mm Na+/K+ phosphate buffer, pH 7.5, was incubated with the indicated concentrations of NaCl on ice for 30 min before MDH activity (the reverse reaction) was determined. The activity of MDH only was used as 100%. n = 4, data are the means ± S.D.
FIGURE 7.
FIGURE 7.
The schematic illustration for the cross-talk between MDH and bc1 complex. Solid arrows show the reactions in the matrix. The dashed arrow in the membrane stands for the electron transport. The dashed arrow in the matrix stands for the NADH generation form the citric acid cycle. The dashed circled c (Cyt c) shows its translocation from complex III to complex IV. SDH, succinate dehydrogenase; Q, ubiquinol/ubiquinone.

References

    1. Trumpower B. L., Gennis R. B. (1994) Annu. Rev. Biochem. 63, 675–716 - PubMed
    1. Xia D., Yu C. A., Kim H., Xia J. Z., Kachurin A. M., Zhang L., Yu L., Deisenhofer J. (1997) Science 277, 60–66 - PubMed
    1. Kim H., Xia D., Yu C. A., Xia J. Z., Kachurin A. M., Zhang L., Yu L., Deisenhofer J. (1998) Proc. Natl. Acad. Sci. U.S.A. 95, 8026–8033 - PMC - PubMed
    1. Iwata S., Lee J. W., Okada K., Lee J. K., Iwata M., Rasmussen B., Link T. A., Ramaswamy S., Jap B. K. (1998) Science 281, 64–71 - PubMed
    1. Berry E. A., Guergova-Kuras M., Huang L. S., Crofts A. R. (2000) Annu. Rev. Biochem. 69, 1005–1075 - PubMed

Publication types

MeSH terms

LinkOut - more resources