. 2010 Mar 12;285(11):8492-506.
doi: 10.1074/jbc.M109.007526. Epub 2010 Jan 14.

CD36 is a novel serum amyloid A (SAA) receptor mediating SAA binding and SAA-induced signaling in human and rodent cells

Affiliations

CD36 is a novel serum amyloid A (SAA) receptor mediating SAA binding and SAA-induced signaling in human and rodent cells

Irina N Baranova et al. J Biol Chem. .

Abstract

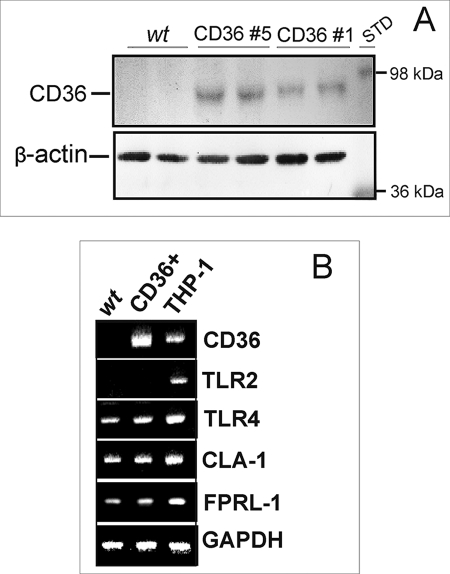
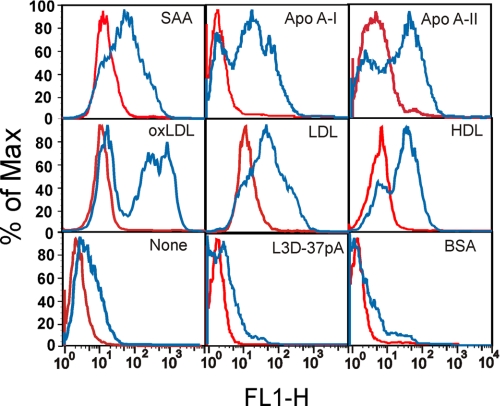
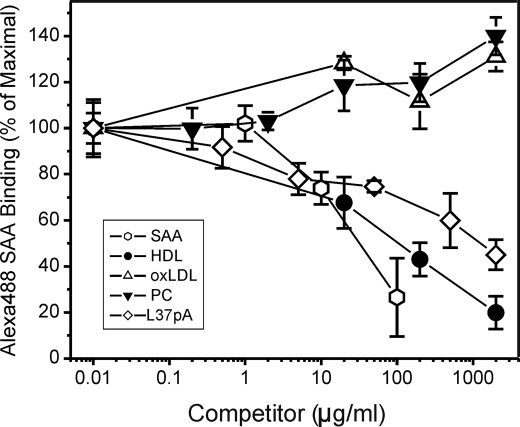
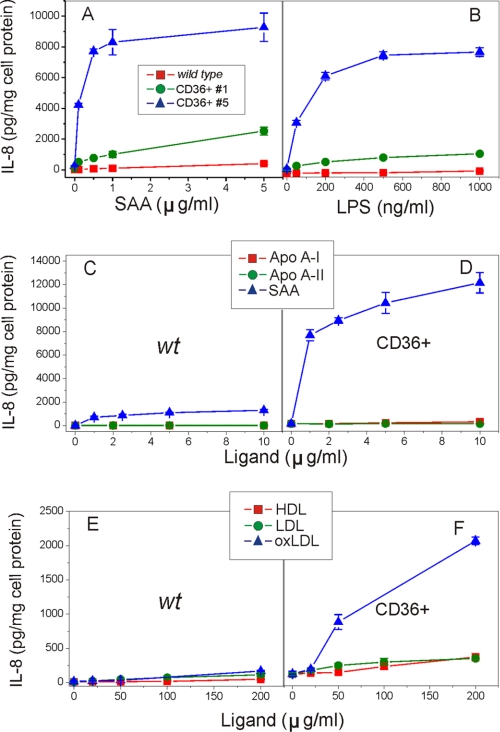
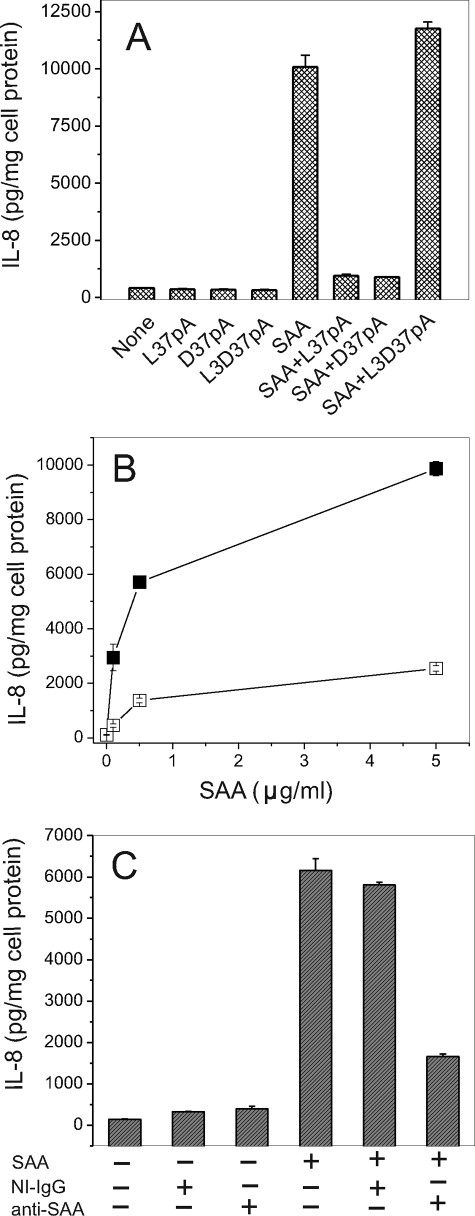
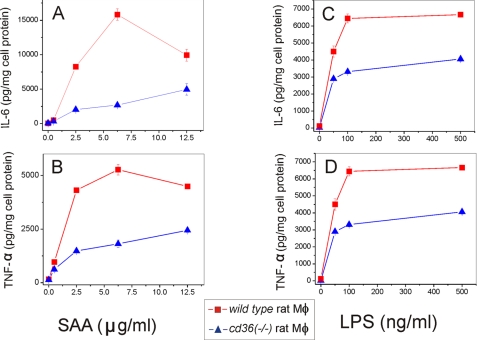
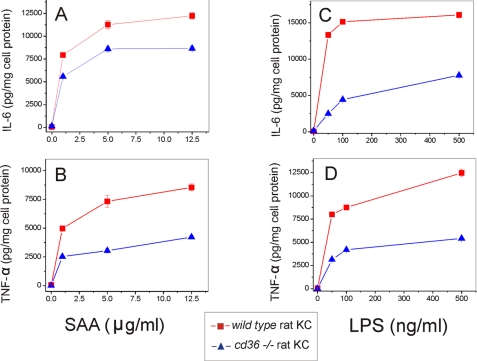
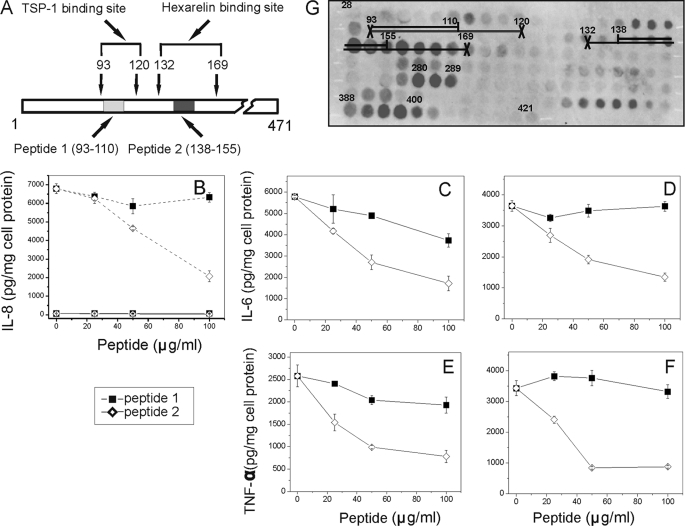
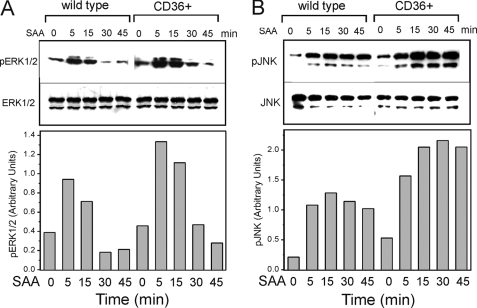
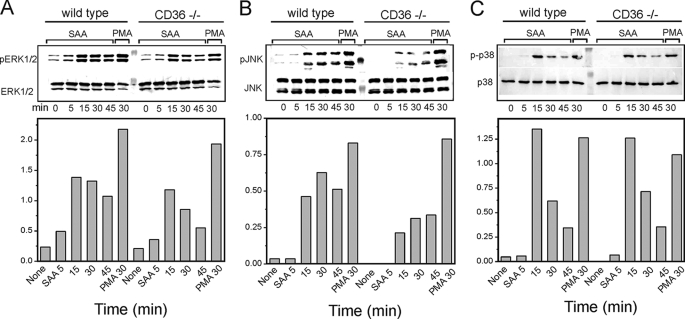
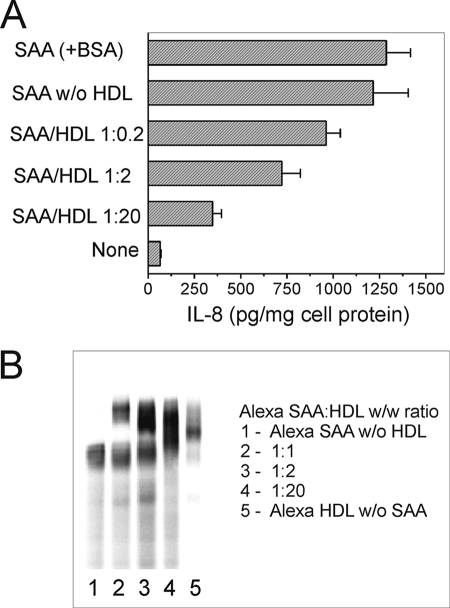
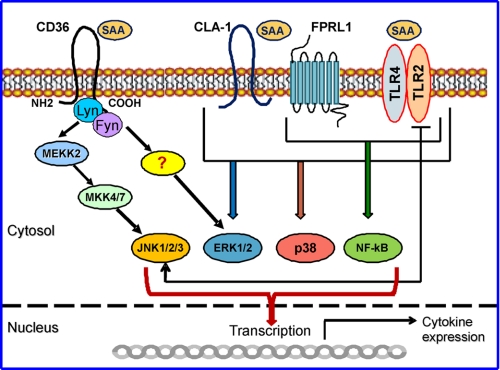
Serum amyloid A (SAA) is a major acute phase protein involved in multiple physiological and pathological processes. This study provides experimental evidence that CD36, a phagocyte class B scavenger receptor, functions as a novel SAA receptor mediating SAA proinflammatory activity. The uptake of Alexa Fluor 488 SAA as well as of other well established CD36 ligands was increased 5-10-fold in HeLa cells stably transfected with CD36 when compared with mock-transfected cells. Unlike other apolipoproteins that bind to CD36, only SAA induced a 10-50-fold increase of interleukin-8 secretion in CD36-overexpressing HEK293 cells when compared with control cells. SAA-mediated effects were thermolabile, inhibitable by anti-SAA antibody, and also neutralized by association with high density lipoprotein but not by association with bovine serum albumin. SAA-induced cell activation was inhibited by a CD36 peptide based on the CD36 hexarelin-binding site but not by a peptide based on the thrombospondin-1-binding site. A pronounced reduction (up to 60-75%) of SAA-induced pro-inflammatory cytokine secretion was observed in cd36(-/-) rat macrophages and Kupffer cells when compared with wild type rat cells. The results of the MAPK phosphorylation assay as well as of the studies with NF-kappaB and MAPK inhibitors revealed that two MAPKs, JNK and to a lesser extent ERK1/2, primarily contribute to elevated cytokine production in CD36-overexpressing HEK293 cells. In macrophages, four signaling pathways involving NF-kappaB and three MAPKs all appeared to contribute to SAA-induced cytokine release. These observations indicate that CD36 is a receptor mediating SAA binding and SAA-induced pro-inflammatory cytokine secretion predominantly through JNK- and ERK1/2-mediated signaling.


Figures

FIGURE 1.
FIGURE 1.
Expression levels of CD36 and other known receptors of SAA in wild type (wt) and CD36-overexpressing HEK293 cells. A, CD36 protein expression as determined by Western blot analyses in WT and two clones of CD36-overexpressing HEK293 cells. STD, standard. B, comparison of mRNA expression levels assessed by reverse transcription-PCR analysis for different SAA receptors in WT, CD36-overexpressing HEK293 cells, and the THP-1 cell line. Each sample was analyzed for glyceraldehyde-3-phosphate dehydrogenase (GADPH) mRNA as a housekeeping gene. The data are from one of three independent determinations that yielded similar results.
FIGURE 2.
FIGURE 2.
Uptake of Alexa Fluor 488-labeled ligands in CD36-overexpressing and mock-transfected HeLa cells. Cells were incubated with each of the following ligands for 1 h at 37 °C: 2.5 μg/ml SAA, 5 μg/ml oxLDL, LDL, or HDL, 10 μg/ml apoA-I, apoA-II, BSA or L-3D37pA. The uptake of each ligand in CD36-overexpressing (blue line) or mock-transfected (red line) cells is indicated on the plot area. Cell-associated fluorescence was estimated by FACS analyses. Data are from one of three separate experiments that yielded similar results.
FIGURE 3.
FIGURE 3.
Competition of CD36 ligands with Alexa Fluor 488 SAA uptake in CD36-overexpressing HeLa cells. Cells were incubated with 5 μg/ml Alexa Fluor 488 SAA without or with indicated concentrations of unlabeled competitors for 2 h at 37 °C. Unlabeled SAA was used as a control. Cell-associated fluorescence was estimated by FACScan analyses. The inhibition curves are expressed as percent of maximal Alexa Fluor 488 SAA uptake in cells incubated in the absence of unlabeled competitor. The data (mean ± S.D.) represent one of three separate experiments that yielded similar results and were performed with triplicate determinations.
FIGURE 4.
FIGURE 4.
Dose-dependent IL-8 secretion induced by various CD36 ligands in CD36-overexpressing and WT HEK293 cells. Control WT cells and two clones of HEK293 cells were incubated with increasing concentrations of SAA (A) or LPS (B) for 20 h. Control WT cells (C and E) and clone 5 (D and F) of HEK293 cells were incubated with increasing doses of apolipoproteins apoA-I, apoA-II, or SAA (0–10 μg/ml) or lipoproteins (0–200 μg/ml) for 20 h. IL-8 levels were determined in cell culture supernatants. Data represent one of three separate experiments that yielded similar results.
FIGURE 5.
FIGURE 5.
Amphipathic α-helical peptides, heat treatment of SAA preparation, and anti-SAA-specific antibody reduce SAA-stimulated IL-8 release by HEK293 CD36-overexpressing cells. A, cells were pre-incubated with 10 μg/ml L-37pA, D-37pA, or L3D-37pA for 45 min prior to a 20-h SAA (1 μg/ml) treatment. B, cells were incubated for 20 h with increasing concentrations of intact (filled squares) or heat-treated (empty squares) (25 min at 100 °C) SAA. C, prior to SAA (1 μg/ml) addition, cells were pre-incubated for 45 min with either anti-SAA IgG or isotype-matched IgG at the same concentrations. IL-8 levels were determined in cell culture supernatants after 20 h.
FIGURE 6.
FIGURE 6.
Dose-dependent SAA- and LPS-induced secretion of IL-6 (A and B) and TNF-α (C and D) in cd36+/+ and cd36−/− rat macrophages. Cells were exposed to increasing concentrations of SAA or LPS for 20 h, and cytokine levels were determined in cell culture supernatants. The results are shown as means ± S.D. from duplicate measurements. Data are from one of the three separate experiments that yielded similar results.
FIGURE 7.
FIGURE 7.
Dose-dependent SAA- and LPS-induced secretion of IL-6 (A and B) and TNF-α (C and D) in cd36+/+and cd36−/− rat Kupffer cells. Cells were exposed to increasing doses of SAA or LPS for 20 h, and cytokine levels were determined in cell culture supernatants. The results are shown as means ± S.D. from duplicate measurements. Data are from one of the two separate experiments that yielded similar results.
FIGURE 8.
FIGURE 8.
Effects of CD36-derived synthetic peptides upon SAA-stimulated IL-8 secretion in HEK293 cells and SAA- and LPS-induced cytokine production in bone marrow-derived rat macrophages. A, location of the binding sites for TSP-1 and hexarelin on the primary sequence of CD36. B, WT HEK293 (solid lines) and CD36-overexpressing (dashed lines) cells were incubated with 1 μg/ml of SAA (A) in the presence or absence of various concentrations of peptides for 20 h. C–F, normal bone marrow-derived macrophages were incubated with 2.5 μg/ml SAA (C and E) or 25 ng/ml LPS (D and F). After harvesting the media, IL-8 (A), IL-6 (C and D), and TNF-α (E and F) levels were measured by enzyme-linked immunosorbent assay. The data (mean ± S.D.) represent one of three separate experiments that yielded similar results. G, Pepscan image of SAA interaction with human CD36 extracellular domain epitopes. Reactivity of 132 20-mer overlapping peptides, spanning the amino acid sequence of the CD36 extracellular loop (aa residues 28–421), with Alexa Fluor 488 SAA was assessed as described under “Experimental Procedures.” Sequences of the peptides within the regions with the most intensive fluorescent spots (145–166, 280–289, and 388–400) were identified as potential sites of SAA interaction with CD36. Numbers placed over the spots indicate the numbers of the first amino acids of the 20-mer peptide sequence.
FIGURE 9.
FIGURE 9.
Immunoblot analyses of SAA-induced ERK1/2 (A) and JNK (B) MAPK phosphorylation in wild type and CD36-overexpressing HEK293. Cells were treated with 1 μg/ml SAA for the indicated time intervals. The expression of nonphosphorylated forms of MAPKs is shown as the loading control. The resulting bands were quantified using ImageJ image processing software (National Institutes of Health). The data are presented as the ratio of integral optic density for phosphorylated MAPK bands to the corresponding integral optic density values for total MAPK bands. The data represent one of three separate experiments that yielded similar results.
FIGURE 10.
FIGURE 10.
Immunoblot analyses of SAA-induced ERK1/2 (A), JNK (B), and p38 (C) phosphorylation in wild type and cd36−/− murine macrophages. Cells were treated either with 0.5 μg/ml SAA for the indicated time intervals or with 25 ng/ml phorbol 12-myristate 13-acetate (PMA) for 30 min. The expression of nonphosphorylated forms of MAPKs is shown as the loading control. The resulting bands were quantified using ImageJ image processing software. The data are presented as the ratio of integral optic density for phosphorylated MAPK bands to the corresponding integral optic density values for total MAPK bands. The data represent one of three separate experiments that yielded similar results.
FIGURE 11.
FIGURE 11.
A, effects of the SAA·HDL complexes, pre-formed in vitro, on IL-8 secretion in CD36-overexpressing HEK293 cells. Cells were incubated with 5 μg/ml SAA, either lipoprotein-free or associated with HDL at various molar ratios (see “Experimental Procedures”) for 20 h, and IL-8 levels were determined in duplicate samples of cell culture supernatants. B, native PAGE of Alexa·SAA·HDL complexes. 10-μl aliquots containing 0.1 μg of Alexa-SAA, either HDL-free (lane 1) or pre-incubated with varying amounts of HDL (lanes 2–4), were analyzed in a 4–20% gradient gel under nondenaturing conditions. A sample containing 1 μg of Alexa-HDL was analyzed to determine the position of the SAA-free HDL (lane 5). Data from one of at least two representative experiments are shown.
FIGURE 12.
FIGURE 12.
Schematic diagram illustrating SAA-induced signaling mediated by CD36 and other known SAA receptors. TLR2, TLR4, FPRL1, and CLA-1 were identified as SAA receptors, mediating its signaling via the MAPK and/or NF-κB signaling pathways. CD36 is shown here as another novel SAA receptor that engages ERK1/2 and JNK signaling cascades upon SAA binding. In cells of the immune system (e.g. macrophages, dendritic cells, neutrophils, etc.) that express multiple SAA receptors, all signaling pathways could equally contribute to SAA-induced cytokine expression. In other cell types, such as epithelial cells, with low or negligible expression of TLR2/TLR4, CD36-dependent SAA-induced signaling via ERK1/2 and JNK-mediated pathways may play a predominant role in the pro-inflammatory cell response.

Similar articles

Cited by

References

    1. Kushner I., Rzewnicki D. L. (1994) Baillieres Clin. Rheumatol. 8, 513–530 - PubMed
    1. Kushner I. (1982) Ann. N.Y. Acad. Sci. 389, 39–48 - PubMed
    1. Uhlar C. M., Whitehead A. S. (1999) Eur. J. Biochem. 265, 501–523 - PubMed
    1. Malle E., Steinmetz A., Raynes J. G. (1993) Atherosclerosis 102, 131–146 - PubMed
    1. Patel H., Fellowes R., Coade S., Woo P. (1998) Scand. J. Immunol. 48, 410–418 - PubMed

Publication types

MeSH terms

LinkOut - more resources