. 2010 Apr 2;285(14):10690-702.
doi: 10.1074/jbc.M109.089755. Epub 2010 Jan 14.

Translational regulation of gene expression by an anaerobically induced small non-coding RNA in Escherichia coli

Affiliations

Translational regulation of gene expression by an anaerobically induced small non-coding RNA in Escherichia coli

Anders Boysen et al. J Biol Chem. .

Abstract

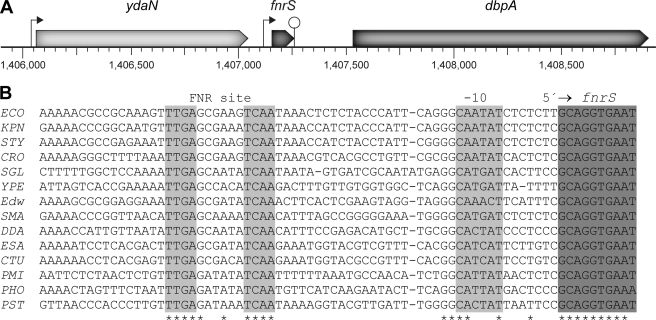
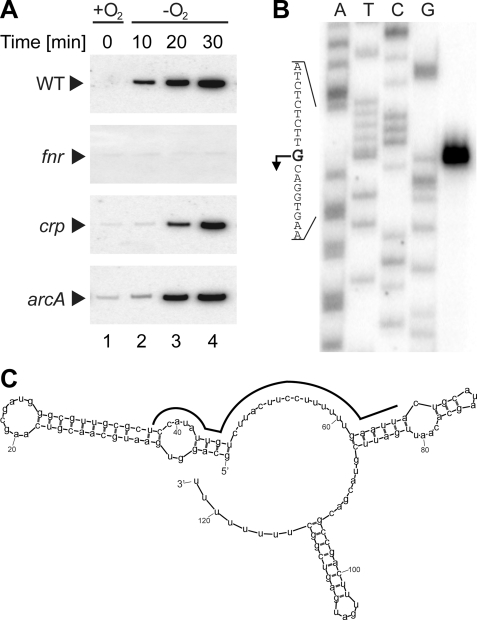
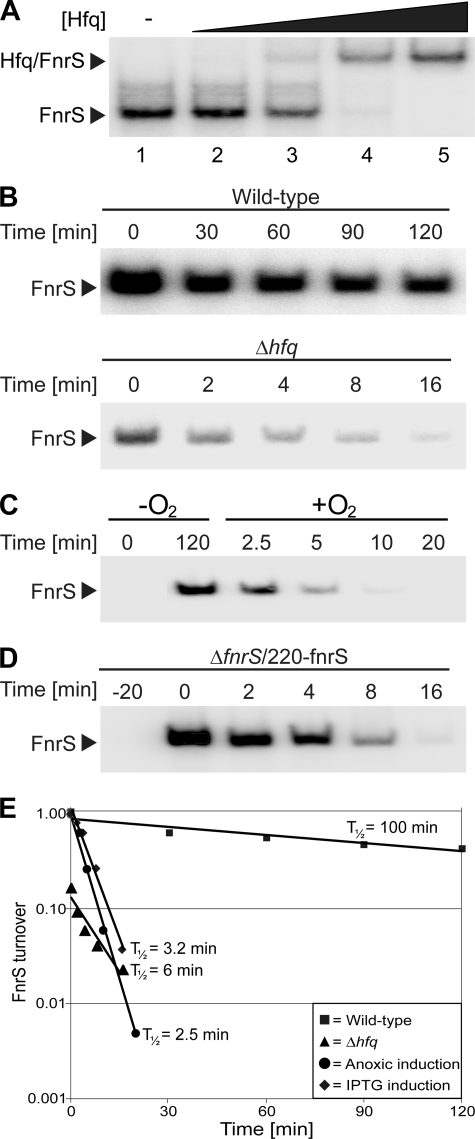
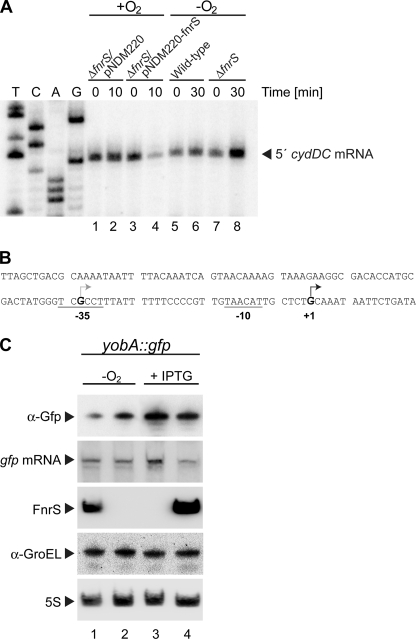
Small non-coding RNAs (sRNA) have emerged as important elements of gene regulatory circuits. In enterobacteria such as Escherichia coli and Salmonella many of these sRNAs interact with the Hfq protein, an RNA chaperone similar to mammalian Sm-like proteins and act in the post-transcriptional regulation of many genes. A number of these highly conserved ribo-regulators are stringently regulated at the level of transcription and are part of major regulons that deal with the immediate response to various stress conditions, indicating that every major transcription factor may control the expression of at least one sRNA regulator. Here, we extend this view by the identification and characterization of a highly conserved, anaerobically induced small sRNA in E. coli, whose expression is strictly dependent on the anaerobic transcriptional fumarate and nitrate reductase regulator (FNR). The sRNA, named FnrS, possesses signatures of base-pairing RNAs, and we show by employing global proteomic and transcriptomic profiling that the expression of multiple genes is negatively regulated by the sRNA. Intriguingly, many of these genes encode enzymes with "aerobic" functions or enzymes linked to oxidative stress. Furthermore, in previous work most of the potential target genes have been shown to be repressed by FNR through an undetermined mechanism. Collectively, our results provide insight into the mechanism by which FNR negatively regulates genes such as sodA, sodB, cydDC, and metE, thereby demonstrating that adaptation to anaerobic growth involves the action of a small regulatory RNA.


Figures

FIGURE 1.
FIGURE 1.
Schematic organization of the fnrS chromosomal region and conservation of the promoter region. A, genetic organization of the E. coli region encoding fnrS is shown. Arrows indicate the direction of transcription, and stem-loop structures of the predicted ρ-independent terminator are indicated by a lollipop. The fnrS gene is highly conserved in a wide range of enterobacteria. B, alignment of the fnrS promoter region of E. coli K-12 (ECO), Klebsiella pneumoniae (KPN), Salmonella typhimurium (STY), Citrobacter rodentium (CRO), Sodalis glossinidius (SGL), Yersinia pestis (YPE), Edwardsiella (EDW), Serratia marcescens (SMA), Dickeya dadantii (DDA), Enterobacter sakazakii (ESA), Cronobacter turicensis (CTU), Proteus mirabilis (PMI), Photorhabdus asymbiotica (PHO), and Providencia stuartii (PST) by the ClustalW program. The −10 promoter element and the FNR DNA binding site are highlighted in gray. The transcription start site of the E. coli fnrS gene is indicated by an arrow.
FIGURE 2.
FIGURE 2.
Transcriptional regulation of fnrS. A, shown is anaerobic regulation of FnrS RNA expression. Wild-type (WT) strain SØ928 and isogenic derivatives containing a chromosomal deletion of fnr, crp, or arcA, respectively, were grown with aeration in LB medium at 37 °C to exponential growth phase (A450 ∼ 0.3). Samples were taken before (lane 1; 0 min) and after (lanes 1–3; 10, 20, 30 min) anaerobic incubation. The levels of FnrS were determined using Northern blot analysis. B, the transcription start site of the E. coli fnrS gene was determined by primer extension analysis with total RNA isolated from SØ928 grown under anaerobic growth conditions (rightmost lane). C, shown is the predicted secondary structure for E. coli FnrS from Mfold (67). The conserved segment of the sRNA that possesses sequence complementarity to the translational initiation region of target mRNAs as well as the predicted binding site for Hfq is marked by a filled line.
FIGURE 3.
FIGURE 3.
Hfq binding and Northern blot analysis of FnrS stability in the absence and presence of ongoing transcription. A, shown is a gel mobility shift assay of Hfq binding to FnrS RNA. Samples containing a 5′ end-labeled transcript of sRNA (4 nm final concentration) were incubated with increasing amounts of Hfq. Final hexameric concentrations of Hfq were 3.3 nm (lanes 2), 16.6 nm (lanes 3), 83.3 nm (lanes 4), and 333.3 nm (lane 5). No protein was added to the binding reaction (lanes 1). B, exponentially grown cultures of wild-type and Δhfq strains were treated with rifampicin to block new transcription. Samples were taken at the indicated times, and total RNA was extracted. FnrS RNA levels were analyzed by Northern blot analysis. Estimated half-lives (t½) are shown in panel E. C, shown is turnover of FnrS in the presence of ongoing transcription. Wild-type (SØ928) cells were grown anaerobically for 120 min, after which the culture was vigorously aerated. Samples were taken at the indicated times, and RNA was extracted and probed for FnrS. D, shown is decay of FnrS upon IPTG-controlled expression. Strain SØ928/ΔfnrS/pNDM220-fnrS was grown aerobically in LB with ampicillin (30 μg/ml) to an A450 of 0.4, and IPTG was added (1 mm final concentration) for 20 min The culture was centrifuged briefly to wash out the inducer and resuspended in an equal volume of prewarmed LB. Samples were taken at the indicated times, and RNA was extracted and probed for FnrS. E, shown is a graphical presentation of FnrS decay calculated from the experiments shown in panels B, C, and D. Full-length FnrS levels from the Northern blots were quantified and normalized as described under “Experimental Procedures.”
FIGURE 4.
FIGURE 4.
FnrS-mediated repression of sodB expression and roles of Hfq. A, strains SØ928ΔfnrS/pNDM220, SØ928ΔfnrS/pNDM220-fnrS, SØ928Δhfq/pNDM220, and SØ928 Δhfq/pNDM220-fnrS were grown aerobically in LB media to an A450 of 0.4 and then induced by the addition of IPTG (final concentration 1 mm). Samples were taken before (time 0), and 10 min after induction and total RNA was extracted. The sodB mRNA and FnrS RNA levels were analyzed by Northern blot. B, shown is accumulation of sodB mRNA in the absence and presence of FnrS RNA upon a sudden shift from aerobic to anaerobic growth. Aerobically grown cells of SØ928 and SØ928ΔfnrS were shifted to anoxia at time 0. Samples were taken at the indicated times, and RNA was extracted and probed for sodB mRNA and FnrS RNA. C, shown is putative base pairing between FnrS RNA and sodB mRNA. The translation start site is indicated. D, Hfq cooperates in RNA-RNA interaction. Samples containing 5′ end-labeled FnrS RNA (2 nm) and increasing amounts of unlabeled sodB′ RNA substrate (from −53 to + 97 relative to the translation start site) were incubated in the absence (lanes 1–4) or in the presence of Hfq (lanes 5–8), and complex formation was monitored in a electrophoretic mobility shift experiment. sodB′ RNA concentrations were as indicated, and the Hfq “hexamer” concentration was 0.33 μm. Unbound FnrS RNA and complexes corresponding to Hfq-FnrS RNA and FnrS RNA-Hfq-sodB′ RNA are indicated by arrows. E, target validation by translational sodB::gfp fusion is shown. In one experiment E. coli strains SØ928 and SØ928 ΔfnrS carrying the target fusion plasmid were grown anaerobically in LB media for at least six generations (A450 ∼ 0.4) (lanes 1 and 2). In another experiment the ΔfnrS/pNDM220 and ΔfnrS/pNDM220-fnrS strains carrying target fusion plasmid were grown aerobically to an A450 of 0.4 in the presence of IPTG (1 mm final concentration) (lanes 3 and 4). For both experiments cells samples were subjected to Western blot analysis with monoclonal α-GFP antibodies (upper panel) and to Northern blot analysis of gfp-fusion mRNA and FnrS RNA (second and third panels). GroEL and 5S were used as loading control for Western and Northern blots, respectively.
FIGURE 5.
FIGURE 5.
FnrS-mediated repression of cydDC mRNA expression. A, shown is primer extension analysis of cydDC 5′ end transcript. fnrS deletion strains containing an empty control vector (pNDM220) or pNDM220-fnrS were grown aerobically in LB medium at 37 °C to exponential growth phase (A450 ∼ 0.3). Samples were taken before (lanes 1 and 3; 0 min) and after (lanes 2 and 4; 10 min) FnrS induction by 1 mm IPTG. Wild-type and fnrS deletion strains were grown aerobically in LB medium at 37 °C to exponential growth phase (A450 ∼ 0.3). Samples were taken before (lanes 5 and 7; 0 min) and after (lanes 6 and 8; 30 min) of anaerobic incubation. B, the transcription start site (black arrow) was mapped to a position 33 bp downstream of the start site reported by Cook et al. (61) (gray arrow) (i.e. start site reassigned from position 930254 to 930221 of the E. coli chromosome). Putative −10 and −35 boxes are underlined. C, shown is validation of post-transcriptional regulation of the yobA-yebZY message by a translational yobA::gfp reporter fusion. The experiment as in Fig. 4E but with the pXG10-yobA′::gfp reporter plasmid.
FIGURE 6.
FIGURE 6.
Effect of FnrS expression on the protein pattern of E. coli. A, the figure shows the relevant part of two-dimensional gels of strains ΔfnrS/pNDM220 (control) and ΔfnrS/pNDM220-fnrS. Cells were grown to log phase in minimal medium supplemented with glucose and then induced with 0.5 mm IPTG for 30 min at 37 °C. After this the cultures were labeled with [35S]methionine for 2 min and concentrated by centrifugation, and their proteins were analyzed by standard two-dimensional gel electrophoresis and autoradiography. The arrows indicate the position of proteins whose net synthesis rate was markedly altered upon FnrS expression. B, left panel, FnrS mediated repression of sodA expression. Strains SØ928ΔfnrS/pNDM220 (control) and SØ928ΔfnrS/pNDM220-fnrS were grown aerobically in LB media to an A450 of 0.4 and then induced by addition of IPTG (final concentration 1 mm). Samples were taken before (time 0) and 10 min after induction, and total RNA was extracted. The sodA mRNA and FnrS RNA levels were analyzed by Northern. B, right panel, shown is the effect of fnrS deletion on sodA expression. Aerobically grown cells of SØ928 and SØ928ΔfnrS were shifted to anoxia at time 0. Samples were taken at the indicated times, and RNA was extracted and probed for sodA mRNA and FnrS RNA. C, Hfq cooperates in RNA-RNA interaction. Samples containing 5′ end-labeled FnrS RNA (2 nm) and increasing amounts of unlabeled sodA1–150 substrate (covering the transcription start site to 97 nucleotides downstream of the translation start site) were incubated in the absence (lanes 1–4) or in the presence of Hfq (lanes 5–8), and complex formation was monitored in a electrophoretic mobility shift experiment. sodA′ RNA concentrations were as indicated, and the Hfq hexamer concentration was 0.33 μm. Unbound FnrS RNA and complexes corresponding to Hfq-FnrS RNA and FnrS RNA-Hfq-sodA′ RNA are indicated by arrows. D, shown is validation of post-transcriptional regulation of sodA expression by a translational sodA::gfp reporter fusion. The experiment was as in Fig. 4E but with the pXG10-sodA′::gfp reporter plasmid. E, the experiment was the same as D but with pXG10-metE′::gfp reporter plasmid.

Similar articles

Cited by

References

    1. Bartel D. P. (2009) Cell 136, 215–233 - PMC - PubMed
    1. Vogel J. (2009) Mol. Microbiol. 71, 1–11 - PubMed
    1. Waters L. S., Storz G. (2009) Cell 136, 615–628 - PMC - PubMed
    1. Altuvia S., Weinstein-Fischer D., Zhang A., Postow L., Storz G. (1997) Cell 90, 43–53 - PubMed
    1. Massé E., Salvail H., Desnoyers G., Arguin M. (2007) Curr. Opin. Microbiol. 10, 140–145 - PubMed

Publication types

MeSH terms