

Combining MR imaging, positron-emission tomography, and CSF biomarkers in the diagnosis and prognosis of Alzheimer disease
- PMID: 20075088
- PMCID: PMC2821467
- DOI: 10.3174/ajnr.A1809
Combining MR imaging, positron-emission tomography, and CSF biomarkers in the diagnosis and prognosis of Alzheimer disease
Abstract
Background and purpose: Different biomarkers for AD may potentially be complementary in diagnosis and prognosis of AD. Our aim was to combine MR imaging, FDG-PET, and CSF biomarkers in the diagnostic classification and 2-year prognosis of MCI and AD, by examining the following: 1) which measures are most sensitive to diagnostic status, 2) to what extent the methods provide unique information in diagnostic classification, and 3) which measures are most predictive of clinical decline.
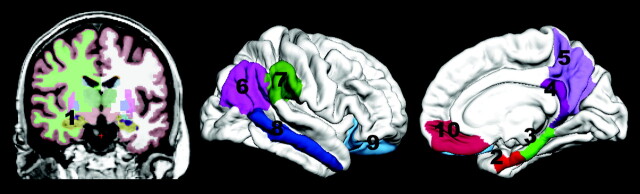
Materials and methods: ADNI baseline MR imaging, FDG-PET, and CSF data from 42 controls, 73 patients with MCI, and 38 patients with AD; and 2-year clinical follow-up data for 36 controls, 51 patients with MCI, and 25 patients with AD were analyzed. The hippocampus and entorhinal, parahippocampal, retrosplenial, precuneus, inferior parietal, supramarginal, middle temporal, lateral, and medial orbitofrontal cortices were used as regions of interest. CSF variables included Abeta42, t-tau, p-tau, and ratios of t-tau/Abeta42 and p-tau/Abeta42. Regression analyses were performed to determine the sensitivity of measures to diagnostic status as well as 2-year change in CDR-SB, MMSE, and delayed logical memory in MCI.
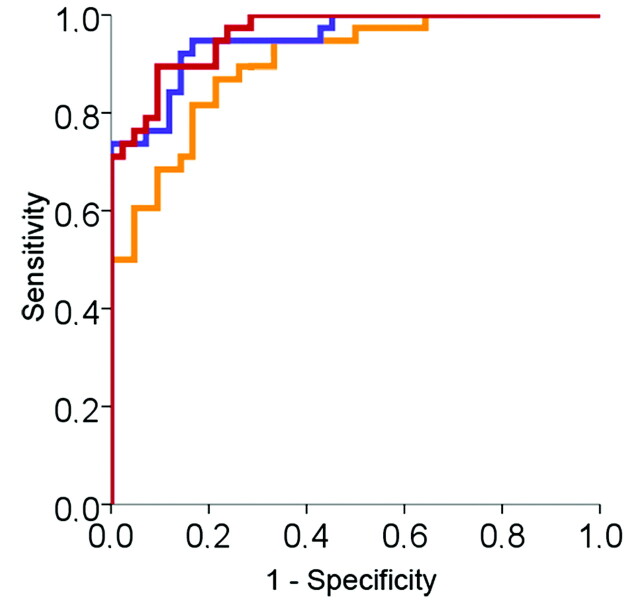
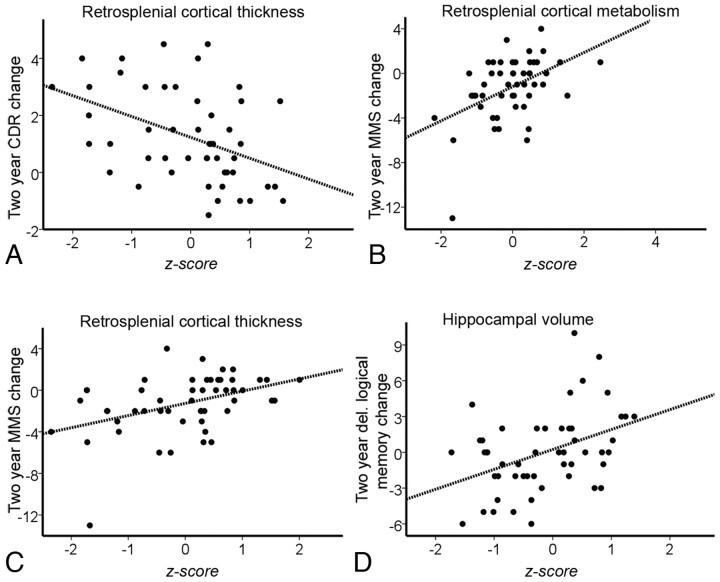
Results: Hippocampal volume, retrosplenial thickness, and t-tau/Abeta42 uniquely predicted diagnostic group. Change in CDR-SB was best predicted by retrosplenial thickness; MMSE, by retrosplenial metabolism and thickness; and delayed logical memory, by hippocampal volume.
Conclusions: All biomarkers were sensitive to the diagnostic group. Combining MR imaging morphometry and CSF biomarkers improved diagnostic classification (controls versus AD). MR imaging morphometry and PET were largely overlapping in value for discrimination. Baseline MR imaging and PET measures were more predictive of clinical change in MCI than were CSF measures.
Figures
References
-
- Mosconi L, Brys M, Glodzik-Sobanska L, et al. Early detection of Alzheimer's disease using neuroimaging. Exp Gerontol 2007;42:129–38 - PubMed
-
- Blennow K, Wallin A, Agren H, et al. Tau protein in cerebrospinal fluid: a biochemical marker for axonal degeneration in Alzheimer disease? Mol Chem Neuropathol 1995;26:231–45 - PubMed
-
- Andreasen N, Blennow K. Beta-amyloid (Abeta) protein in cerebrospinal fluid as a biomarker for Alzheimer's disease. Peptides 2002;23:1205–14 - PubMed
Publication types
MeSH terms
Substances
Grants and funding
LinkOut - more resources
Full Text Sources
Medical