

Genome-wide discovery of human heart enhancers
- PMID: 20075146
- PMCID: PMC2840982
- DOI: 10.1101/gr.098657.109
Genome-wide discovery of human heart enhancers
Abstract
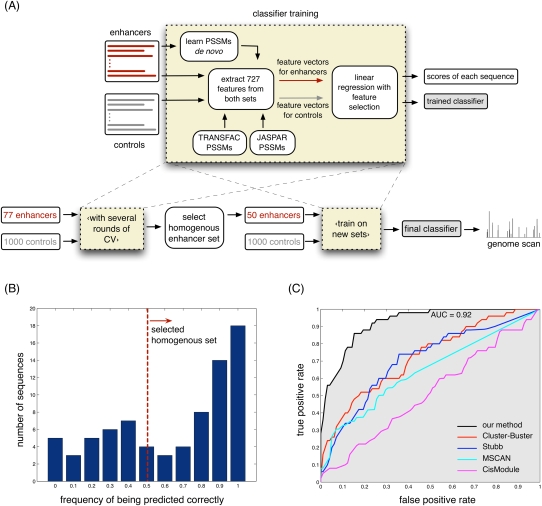
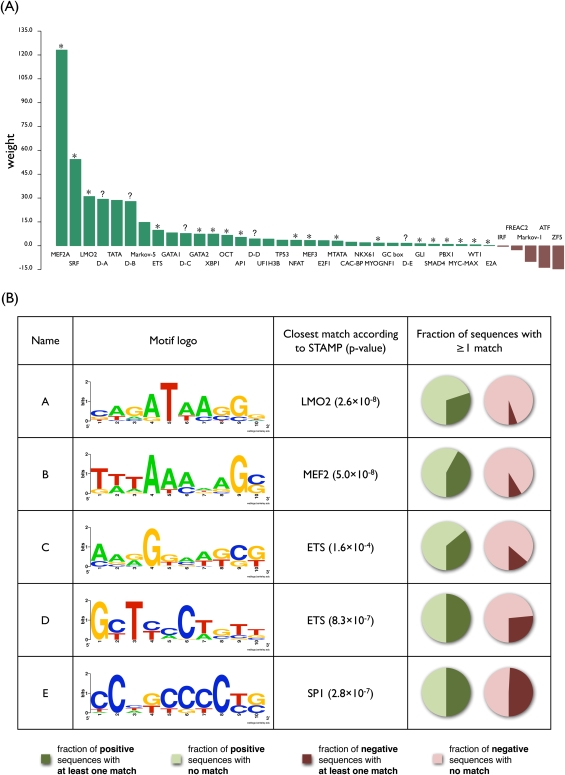
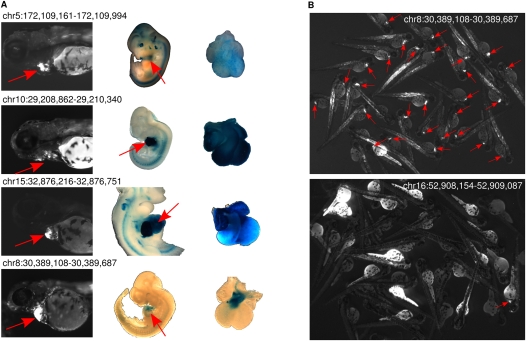
The various organogenic programs deployed during embryonic development rely on the precise expression of a multitude of genes in time and space. Identifying the cis-regulatory elements responsible for this tightly orchestrated regulation of gene expression is an essential step in understanding the genetic pathways involved in development. We describe a strategy to systematically identify tissue-specific cis-regulatory elements that share combinations of sequence motifs. Using heart development as an experimental framework, we employed a combination of Gibbs sampling and linear regression to build a classifier that identifies heart enhancers based on the presence and/or absence of various sequence features, including known and putative transcription factor (TF) binding specificities. In distinguishing heart enhancers from a large pool of random noncoding sequences, the performance of our classifier is vastly superior to four commonly used methods, with an accuracy reaching 92% in cross-validation. Furthermore, most of the binding specificities learned by our method resemble the specificities of TFs widely recognized as key players in heart development and differentiation, such as SRF, MEF2, ETS1, SMAD, and GATA. Using our classifier as a predictor, a genome-wide scan identified over 40,000 novel human heart enhancers. Although the classifier used no gene expression information, these novel enhancers are strongly associated with genes expressed in the heart. Finally, in vivo tests of our predictions in mouse and zebrafish achieved a validation rate of 62%, significantly higher than what is expected by chance. These results support the existence of underlying cis-regulatory codes dictating tissue-specific transcription in mammalian genomes and validate our enhancer classifier strategy as a method to uncover these regulatory codes.
Figures

Similar articles
-
Predicting genome-wide tissue-specific enhancers via combinatorial transcription factor genomic occupancy analysis.FEBS Lett. 2025 Jan;599(1):100-119. doi: 10.1002/1873-3468.15030. Epub 2024 Oct 4. FEBS Lett. 2025. PMID: 39367524
-
Sequence signatures extracted from proximal promoters can be used to predict distal enhancers.Genome Biol. 2013;14(10):R117. doi: 10.1186/gb-2013-14-10-r117. Genome Biol. 2013. PMID: 24156763 Free PMC article.
-
Experimental validation of predicted mammalian erythroid cis-regulatory modules.Genome Res. 2006 Dec;16(12):1480-92. doi: 10.1101/gr.5353806. Epub 2006 Oct 12. Genome Res. 2006. PMID: 17038566 Free PMC article.
-
Efficient identification of regulatory sequences in the chicken genome by a powerful combination of embryo electroporation and genome comparison.Mech Dev. 2004 Sep;121(9):1145-58. doi: 10.1016/j.mod.2004.05.009. Mech Dev. 2004. PMID: 15296978 Review.
-
Transposable elements as a potent source of diverse cis-regulatory sequences in mammalian genomes.Philos Trans R Soc Lond B Biol Sci. 2020 Mar 30;375(1795):20190347. doi: 10.1098/rstb.2019.0347. Epub 2020 Feb 10. Philos Trans R Soc Lond B Biol Sci. 2020. PMID: 32075564 Free PMC article. Review.
Cited by
-
Epigenomic model of cardiac enhancers with application to genome wide association studies.Pac Symp Biocomput. 2013:92-102. Pac Symp Biocomput. 2013. PMID: 23424115 Free PMC article.
-
Statistical significance of combinatorial regulations.Proc Natl Acad Sci U S A. 2013 Aug 6;110(32):12996-3001. doi: 10.1073/pnas.1302233110. Epub 2013 Jul 23. Proc Natl Acad Sci U S A. 2013. PMID: 23882073 Free PMC article.
-
Transcription factors: from enhancer binding to developmental control.Nat Rev Genet. 2012 Sep;13(9):613-26. doi: 10.1038/nrg3207. Epub 2012 Aug 7. Nat Rev Genet. 2012. PMID: 22868264 Review.
-
Identifying transcriptional cis-regulatory modules in animal genomes.Wiley Interdiscip Rev Dev Biol. 2015 Mar-Apr;4(2):59-84. doi: 10.1002/wdev.168. Epub 2014 Dec 29. Wiley Interdiscip Rev Dev Biol. 2015. PMID: 25704908 Free PMC article. Review.
-
Transcriptional Programs and Regeneration Enhancers Underlying Heart Regeneration.J Cardiovasc Dev Dis. 2018 Dec 22;6(1):2. doi: 10.3390/jcdd6010002. J Cardiovasc Dev Dis. 2018. PMID: 30583498 Free PMC article. Review.
References
-
- Aitola M, Carlsson P, Mahlapuu M, Enerback S, Pelto-Huikko M. Forkhead transcription factor FoxF2 is expressed in mesodermal tissues involved in epithelio-mesenchymal interactions. Dev Dyn. 2000;218:136–149. - PubMed
-
- Andres V, Cervera M, Mahdavi V. Determination of the consensus binding site for MEF2 expressed in muscle and brain reveals tissue-specific sequence constraints. J Biol Chem. 1995;270:23246–23249. - PubMed
-
- Bailey TL, Gribskov M. Combining evidence using p-values: Application to sequence homology searches. Bioinformatics. 1998;14:48–54. - PubMed
-
- Bi W, Drake CJ, Schwarz JJ. The transcription factor MEF2C-null mouse exhibits complex vascular malformations and reduced cardiac expression of angiopoietin 1 and VEGF. Dev Biol. 1999;211:255–267. - PubMed
Publication types
MeSH terms
Grants and funding
LinkOut - more resources
Full Text Sources
Miscellaneous