

Utility of genetic and non-genetic risk factors in prediction of type 2 diabetes: Whitehall II prospective cohort study
- PMID: 20075150
- PMCID: PMC2806945
- DOI: 10.1136/bmj.b4838
Utility of genetic and non-genetic risk factors in prediction of type 2 diabetes: Whitehall II prospective cohort study
Abstract
Objectives: To assess the performance of a panel of common single nucleotide polymorphisms (genotypes) associated with type 2 diabetes in distinguishing incident cases of future type 2 diabetes (discrimination), and to examine the effect of adding genetic information to previously validated non-genetic (phenotype based) models developed to estimate the absolute risk of type 2 diabetes.
Design: Workplace based prospective cohort study with three 5 yearly medical screenings.
Participants: 5535 initially healthy people (mean age 49 years; 33% women), of whom 302 developed new onset type 2 diabetes over 10 years.
Outcome measures: Non-genetic variables included in two established risk models-the Cambridge type 2 diabetes risk score (age, sex, drug treatment, family history of type 2 diabetes, body mass index, smoking status) and the Framingham offspring study type 2 diabetes risk score (age, sex, parental history of type 2 diabetes, body mass index, high density lipoprotein cholesterol, triglycerides, fasting glucose)-and 20 single nucleotide polymorphisms associated with susceptibility to type 2 diabetes. Cases of incident type 2 diabetes were defined on the basis of a standard oral glucose tolerance test, self report of a doctor's diagnosis, or the use of anti-diabetic drugs.
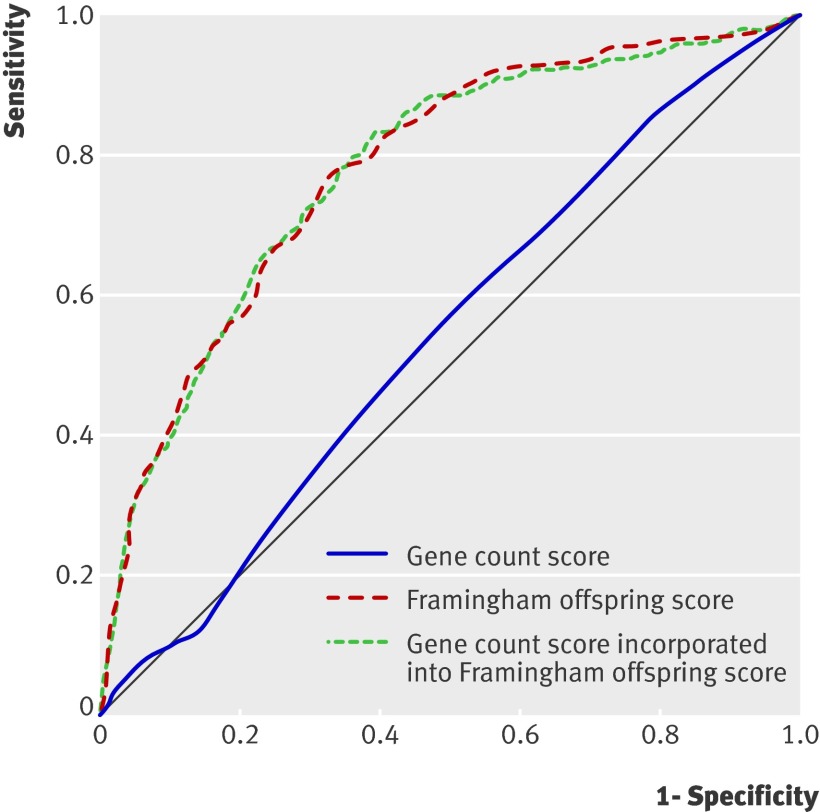
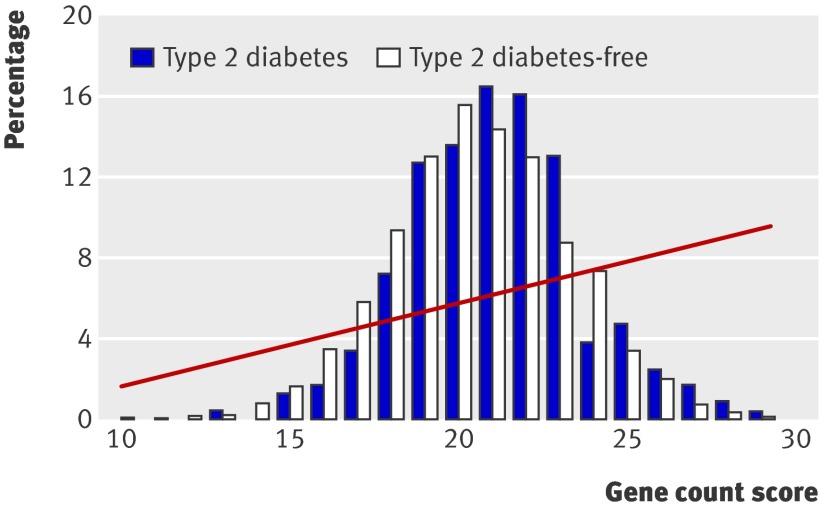
Results: A genetic score based on the number of risk alleles carried (range 0-40; area under receiver operating characteristics curve 0.54, 95% confidence interval 0.50 to 0.58) and a genetic risk function in which carriage of risk alleles was weighted according to the summary odds ratios of their effect from meta-analyses of genetic studies (area under receiver operating characteristics curve 0.55, 0.51 to 0.59) did not effectively discriminate cases of diabetes. The Cambridge risk score (area under curve 0.72, 0.69 to 0.76) and the Framingham offspring risk score (area under curve 0.78, 0.75 to 0.82) led to better discrimination of cases than did genotype based tests. Adding genetic information to phenotype based risk models did not improve discrimination and provided only a small improvement in model calibration and a modest net reclassification improvement of about 5% when added to the Cambridge risk score but not when added to the Framingham offspring risk score.
Conclusion: The phenotype based risk models provided greater discrimination for type 2 diabetes than did models based on 20 common independently inherited diabetes risk alleles. The addition of genotypes to phenotype based risk models produced only minimal improvement in accuracy of risk estimation assessed by recalibration and, at best, a minor net reclassification improvement. The major translational application of the currently known common, small effect genetic variants influencing susceptibility to type 2 diabetes is likely to come from the insight they provide on causes of disease and potential therapeutic targets.
Conflict of interest statement
Competing interests: ADH is on the editorial board of
Figures
References
-
- Bonora E, Kiechl S, Willeit J, Oberhollenzer F, Egger G, Meigs JB, et al. Population-based incidence rates and risk factors for type 2 diabetes in white individuals: the Bruneck study. Diabetes 2004;53:1782-9. - PubMed
-
- Wilson PW, D’Agostino RB, Levy D, Belanger AM, Silbershatz H, Kannel WB. Prediction of coronary heart disease using risk factor categories. Circulation 1998;97:1837-47. - PubMed
-
- Assmann G, Cullen P, Schulte H. Simple scoring scheme for calculating the risk of acute coronary events based on the 10-year follow-up of the prospective cardiovascular Munster (PROCAM) study. Circulation 2002;105:310-5. - PubMed
Publication types
MeSH terms
Grants and funding
- RG/05/014/BHF_/British Heart Foundation/United Kingdom
- G19/35/MRC_/Medical Research Council/United Kingdom
- G0100222/MRC_/Medical Research Council/United Kingdom
- AG13196/AG/NIA NIH HHS/United States
- DH_/Department of Health/United Kingdom
- G0902037/MRC_/Medical Research Council/United Kingdom
- RG/02/005/BHF_/British Heart Foundation/United Kingdom
- FS05/125/BHF_/British Heart Foundation/United Kingdom
- HS06516/HS/AHRQ HHS/United States
- G8802774/MRC_/Medical Research Council/United Kingdom
- PG/07/133/BHF_/British Heart Foundation/United Kingdom
- RG/07/008/23674/BHF_/British Heart Foundation/United Kingdom
LinkOut - more resources
Full Text Sources
Other Literature Sources
Medical