. 2010 Mar 18;115(11):2251-9.
doi: 10.1182/blood-2009-07-231191. Epub 2010 Jan 14.

The ubiquitin-activating enzyme E1 as a therapeutic target for the treatment of leukemia and multiple myeloma

Affiliations

The ubiquitin-activating enzyme E1 as a therapeutic target for the treatment of leukemia and multiple myeloma

G Wei Xu et al. Blood. .

Abstract

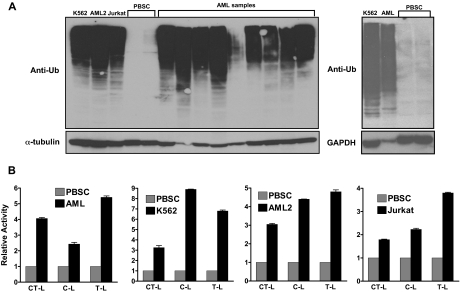
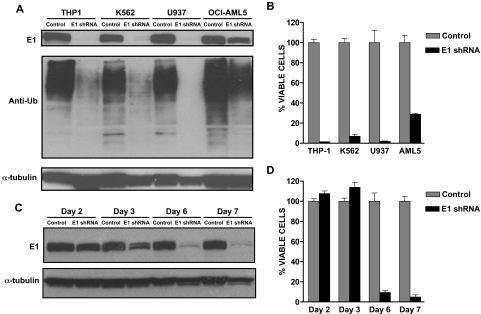
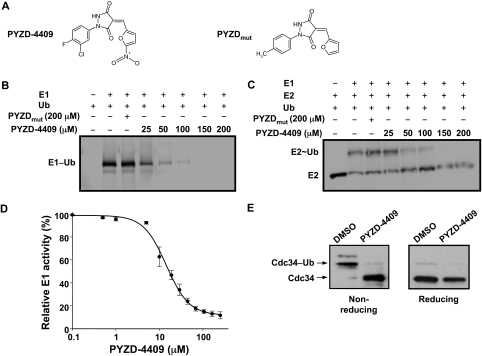
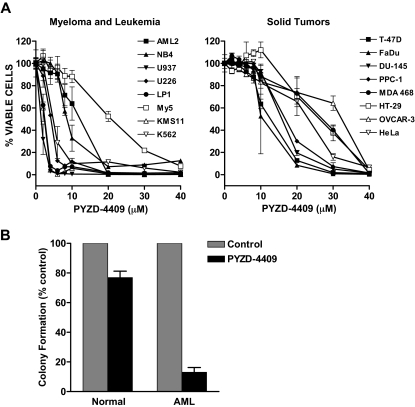
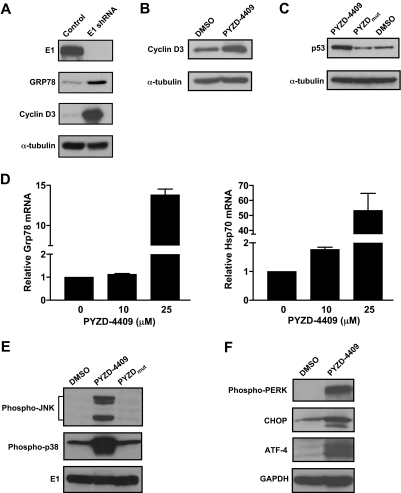
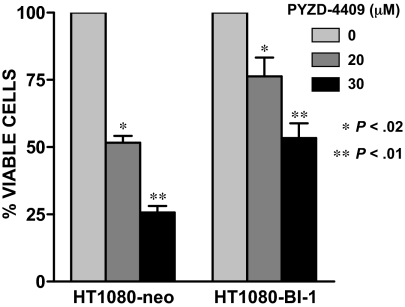
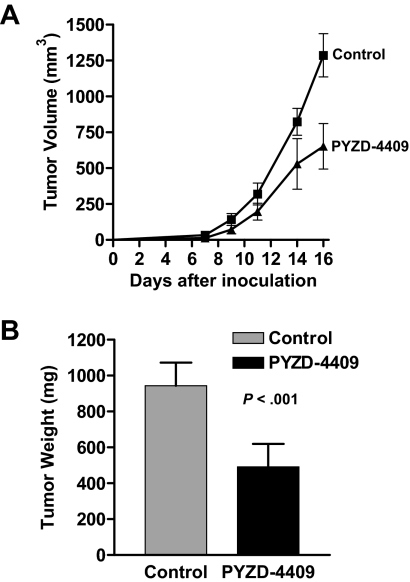
The proteasomal pathway of protein degradation involves 2 discrete steps: ubiquitination and degradation. Here, we evaluated the effects of inhibiting the ubiquitination pathway at the level of the ubiquitin-activating enzyme UBA1 (E1). By immunoblotting, leukemia cell lines and primary patient samples had increased protein ubiquitination. Therefore, we examined the effects of genetic and chemical inhibition of the E1 enzyme. Knockdown of E1 decreased the abundance of ubiquitinated proteins in leukemia and myeloma cells and induced cell death. To further investigate effects of E1 inhibition in malignancy, we discovered a novel small molecule inhibitor, 3,5-dioxopyrazolidine compound, 1-(3-chloro-4-fluorophenyl)-4-[(5-nitro-2-furyl)methylene]-3,5-pyrazolidinedione (PYZD-4409). PYZD-4409 induced cell death in malignant cells and preferentially inhibited the clonogenic growth of primary acute myeloid leukemia cells compared with normal hematopoietic cells. Mechanistically, genetic or chemical inhibition of E1 increased expression of E1 stress markers. Moreover, BI-1 overexpression blocked cell death after E1 inhibition, suggesting ER stress is functionally important for cell death after E1 inhibition. Finally, in a mouse model of leukemia, intraperitoneal administration of PYZD-4409 decreased tumor weight and volume compared with control without untoward toxicity. Thus, our work highlights the E1 enzyme as a novel target for the treatment of hematologic malignancies.


Figures

Figure 1
Figure 1
The activity of the ubiquitination pathway is increased in malignant cell lines and primary patient samples. (A) Total cellular proteins were isolated from leukemia cell lines, primary AML patient samples, and normal hematopoietic cells (PBSCs). Equal amounts of protein were analyzed by SDS-PAGE followed by immunoblotting with anti-ubiquitin, anti–α-tubulin, or anti-GAPDH antibodies (the latter as protein loading control). (B) Proteasome chymotrypsin-like (CT-L), caspase-like (C-L), and trypsin-like (T-L) activities were measured in primary AML (n = 12), primary normal hematopoietic cells (n = 6), and leukemia cell lines as described in “20S proteasome assays” with the use of cell lysates that were prepared from the samples that included those used for immunoblotting assays in panel A. Data represent the mean fold increase ± SD activity compared with the PBSC normal controls.
Figure 2
Figure 2
Knockdown of the E1 enzyme induces cell death in malignant cells. (A) THP1, K562, U937, and OCI-AML5 leukemia cells were infected with an E1 shRNA lentiviral vector or control sequences, and populations of infected cells were selected. Total cellular proteins were isolated and analyzed by SDS-PAGE followed by immunoblotting with the use of anti-E1, anti-ubiquitin, and anti–α-tubulin antibodies. (B) Cells infected with an E1 shRNA lentiviral vector or control sequences were seeded 24 hours after infection into 96-well plates (5 × 10³ cells/well) in the presence of puromycin to select for infected cells. Seven days after seeding, cell growth and viability were assessed by the MTS assay. Data represent the mean percentage ± SD of viable cells relative to cells infected with control sequences (n = 3). A representative experiment is shown. (C) K562 leukemia cells were infected with an E1 shRNA lentiviral vector or control sequences, and populations of infected cells were harvested at increasing times after infection. Total cellular proteins were isolated and analyzed by SDS-PAGE followed by immunoblotting with the use of anti-E1 and anti–α-tubulin antibodies. (D) Cells infected with an E1 shRNA lentiviral vector or control sequences were seeded 24 hours after infection into 96-well plates (5 × 10³ cells/well) in the presence of puromycin to select for infected cells. At increasing times after seeding, cell growth and viability were assessed by the MTS assay. Data represent the mean percentage ± SD of viable cells relative to cells infected with control sequences (n = 3). A representative experiment is shown.
Figure 3
Figure 3
PYZD-4409 inhibits the E1 enzyme. (A) Chemical structure of the E1 inhibitor PYZD-4409 and the inactive control PYZDmut. (B) GST-tagged human E1 (0.5μM) and fluorescein-labeled ubiquitin (1μM) were coincubated with increasing concentrations of PYZD-4409 or PYZDmut for 30 minutes and resolved on SDS-PAGE under nonreducing conditions. Formation of E1-Ub conjugates were assessed by visualization of fluorescent signals using a gel imager. (C) GST-tagged human E1 (1μM), His6-tagged human E2 (UbcH5A; 5μM), ubiquitin (20μM), and ATP (1mM) were coincubated with or without increasing concentrations of PYZD-4409 or PYZDmut for 30 minutes at 30°C. The reactions were then fractionated on 4% to 20% gradient SDS-PAGE followed by immunoblotting with anti-His antibodies and fluorescent dye–labeled secondary antibodies. Fluorescent signals were detected with an infrared imaging system. (D) Recombinant His-tagged human E1 (1μM) was incubated with the His-tagged human UbcH5A E2 enzyme (10μM), ubiquitin (20μM), and ATP (1mM) in the presence of increasing concentrations of PYZD-4409 for 30 minutes at 30°C. Inorganic pyrophosphate resulting from ATP hydrolysis in E1-catalyzed ubiquitin activation was quantified with the use of a fluorogenic pyrophosphate assay kit and a fluorescence microplate reader as described in “E1 enzymatic assays.” Data represent the mean percentage ± SD of E1 enzyme activity compared with buffer-treated controls (n = 3). A representative experiment is shown. (E) K562 cells were treated with PYZD-4409 (50μM) for 4 hours. Cell lysates were heated in either nonreducing or reducing SDS-PAGE sample buffer and fractionated on 10% SDS-PAGE, followed by immunoblotting with antibodies against the E2 protein cdc34.
Figure 4
Figure 4
Inhibition of the E1 enzyme with PYZD-4409 preferentially induces cell death in malignant cell lines and primary AML cells over normal hematopoietic cells. (A) Myeloma, leukemia, and solid tumor cell lines were treated with increasing concentrations of PYZD-4409 for 72 hours. After incubation, cell growth and viability was measured by the Alamar Blue assay. Data represent the mean percentage ± SD of viable cells relative to control. Representative experiments are shown. (B) Mononuclear cells from patients with AML (n = 2) and the PBSCs of donors for allotransplantation (n = 4) were treated with PYZD-4409 (10μM) for 24 hours and then plated in duplicate for clonogenic growth in media containing 1% methylcellulose and cytokines. The numbers of colonies were counted after incubation for 7 days (AML) or 2 weeks (normal). Data represent the mean percentage ± SD of colonies relative to buffer-treated controls.
Figure 5
Figure 5
E1 inhibition increases short half-life proteins and induces ER stress. (A) K562 cells were infected with an E1 shRNA lentiviral vector or control sequences and selected as described in Figure 2. Total cell lysates were prepared and analyzed by SDS-PAGE immunoblotting with anti-E1, anti-GRP78, anti-cyclin D3, and anti–α-tubulin antibodies. (B) K562 cells were treated with PYZD-4409 or PYZDmut (50μM) for 4 hours. After incubation, total cellular proteins were isolated and analyzed by SDS-PAGE immunoblotting with anti-cyclin D3 and anti–α-tubulin antibodies. (C) HCT116 cells were treated with PYZD-4409 or PYZDmut (50μM) for 2 hours. After incubation, total cellular proteins were isolated and analyzed by SDS-PAGE immunoblotting with anti-p53 and anti–α-tubulin antibodies. (D) K562 cells were treated with PYZD-4409 at the concentrations indicated for 24 hours, and total cellular RNA was isolated. GRP78 and HSP70 mRNA expression was measured relative to 18S RNA by real-time RT-PCR. Data points represent the mean ± SD fold increase of GRP78 and HSP70/18S expression relative to controls (ΔΔCT normalization). (E) K562 cells were treated with PYZD-4409 (50μM), PYZDmut (50μM), or DMSO for 2.5 hours. After incubation, total cellular proteins were isolated and analyzed by SDS-PAGE immunoblotting with anti–phospho-JNK, phospho-p38 mitogen-activated protein kinase, and anti-E1. The E1 serves as a protein loading control. (F) MDAY-D2 cells were treated with PYZD-4409 (10μM) or DMSO for 24 hours. After incubation, total cellular proteins were isolated and analyzed by SDS-PAGE immunoblotting with anti–phospho-PERK, anti-CHOP, anti–ATF-4 and antitubulin antibodies.
Figure 6
Figure 6
BI-1 overexpression inhibited PYZD-4409–induced cell death. HT1080–BI-1 and HT1080-neo cells (3 × 10³) were seeded overnight in 96-well plates. The next day, cells were treated with increasing concentrations of PYZD-4409 for 24 hours. Cell growth and viability was determined by the Alamar Blue assay. Data represent the mean percentage ± SD of viable cells relative to control (n = 3). A representative experiment is shown.
Figure 7
Figure 7
PYZD-4409 delays tumor growth in mouse model of leukemia. (A) MDAY-D2 murine leukemia cells (1 × 10⁵) were injected subcutaneously into male SCID mice (n = 20). Starting the next day, animals were treated with PYZD-4409 (10 mg/kg; n = 10) in saline by intraperitoneal injection or vehicle alone (n = 10) once every other day over 8 days. Tumor growth was monitored at least every other day by external calipers. (B) At 16 days after tumor injection, mice were killed, and tumors were excised and weighed. Data represent the mean tumor weight ± SD. A representative experiment is shown.

Similar articles

Cited by

References

    1. Fisher RI, Bernstein SH, Kahl BS, et al. Multicenter phase II study of bortezomib in patients with relapsed or refractory mantle cell lymphoma. J Clin Oncol. 2006;24(30):4867–4874. - PubMed
    1. Richardson PG, Sonneveld P, Schuster MW, et al. Bortezomib or high-dose dexamethasone for relapsed multiple myeloma. N Engl J Med. 2005;352(24):2487–2498. - PubMed
    1. Hershko A, Ciechanover A. The ubiquitin system. Annu Rev Biochem. 1998;67:425–479. - PubMed
    1. Hershko A. The ubiquitin system for protein degradation and some of its roles in the control of the cell division cycle. Cell Death Differ. 2005;12(9):1191–1197. - PubMed
    1. Burger AM, Seth AK. The ubiquitin-mediated protein degradation pathway in cancer: therapeutic implications. Eur J Cancer. 2004;40(15):2217–2229. - PubMed

Publication types

MeSH terms