

A genome-wide linkage scan identifies multiple quantitative trait loci for HDL-cholesterol levels in families with premature CAD and MI
- PMID: 20075193
- PMCID: PMC3035507
- DOI: 10.1194/jlr.M004325
A genome-wide linkage scan identifies multiple quantitative trait loci for HDL-cholesterol levels in families with premature CAD and MI
Abstract
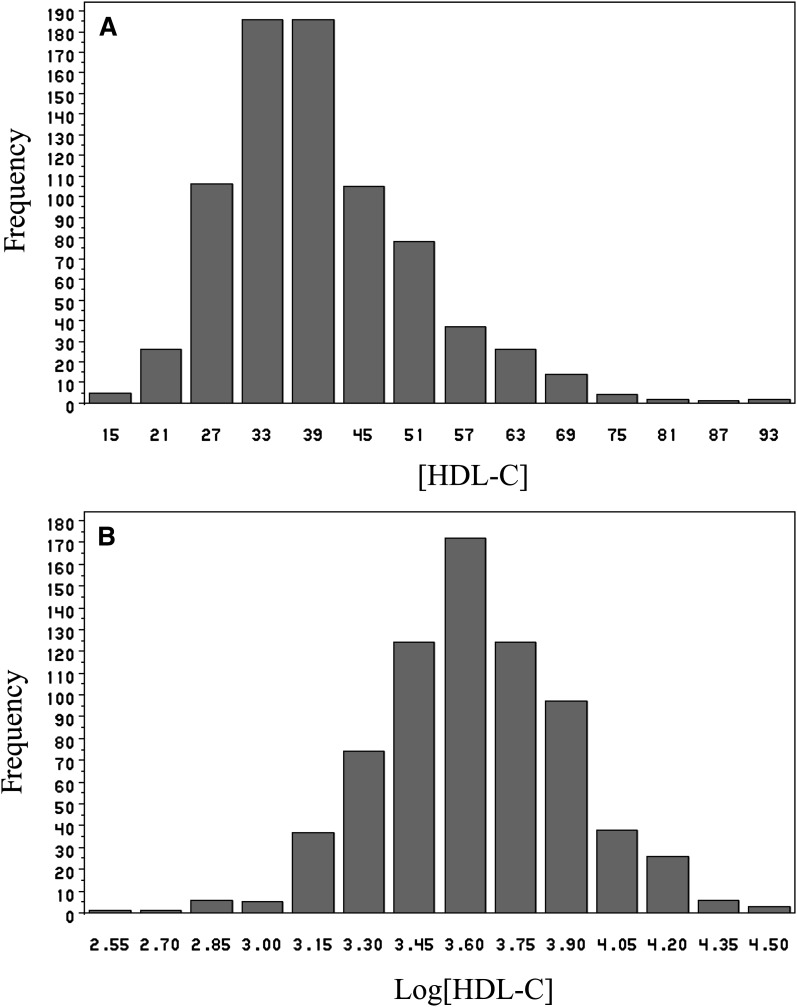
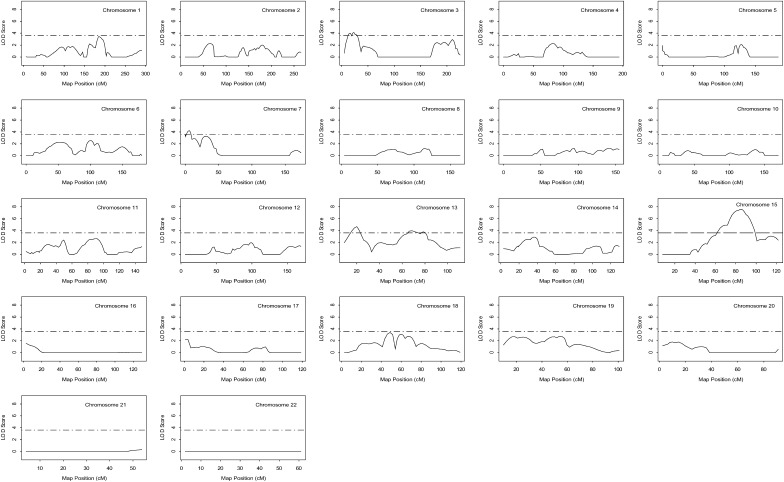
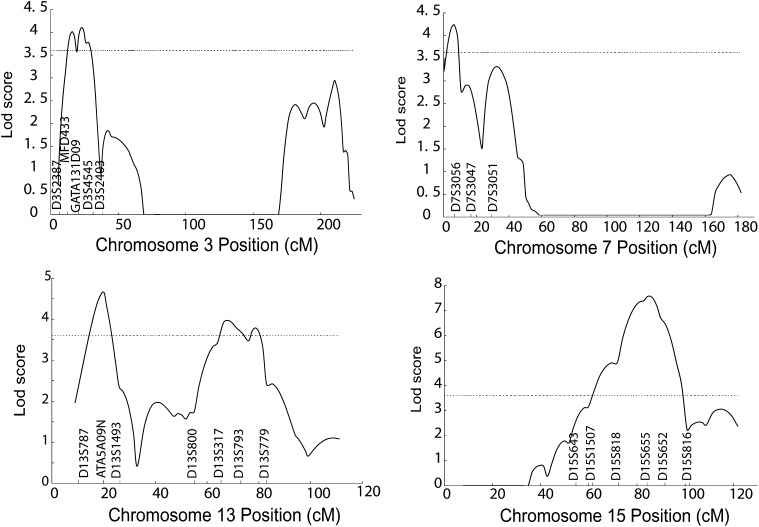
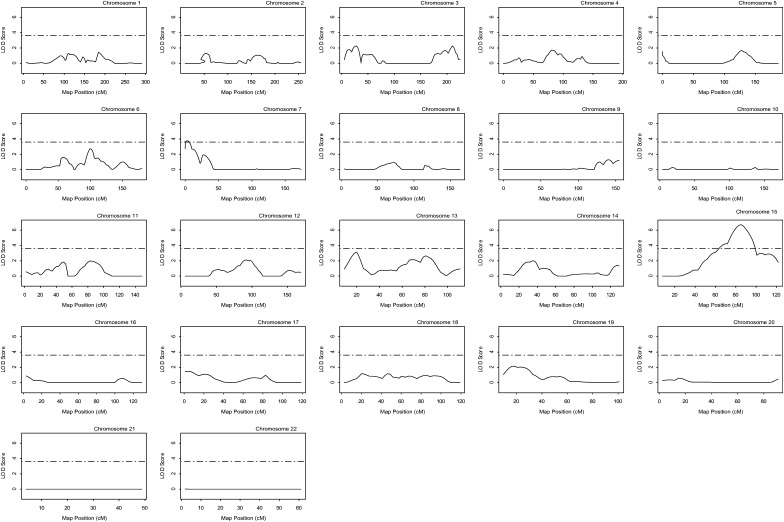
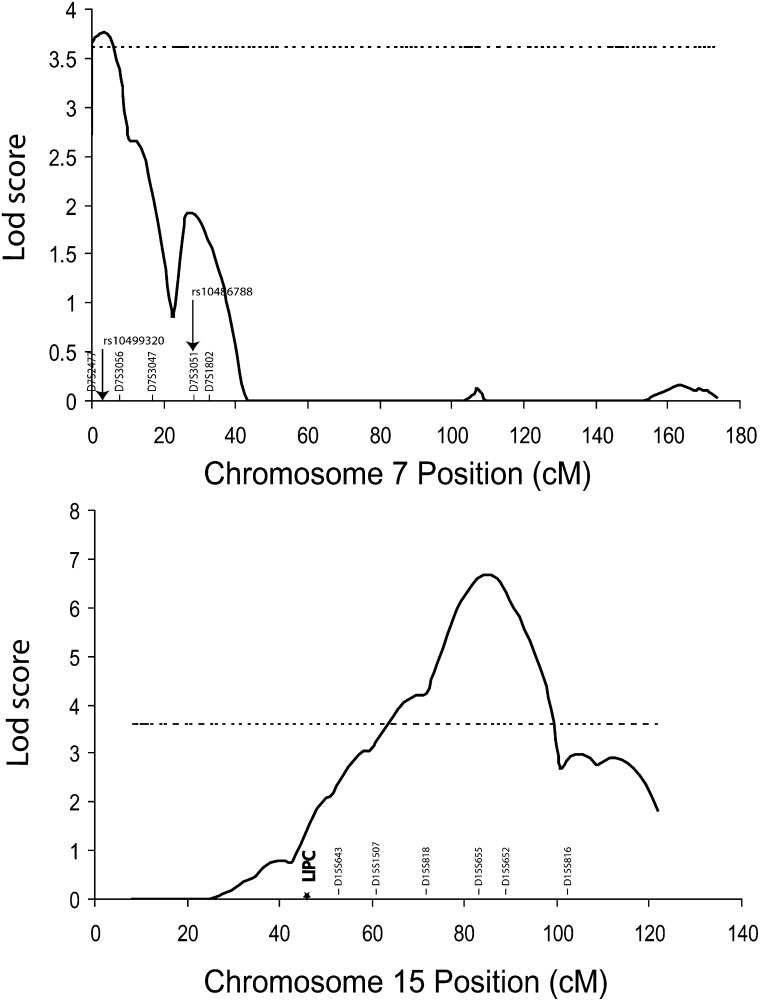
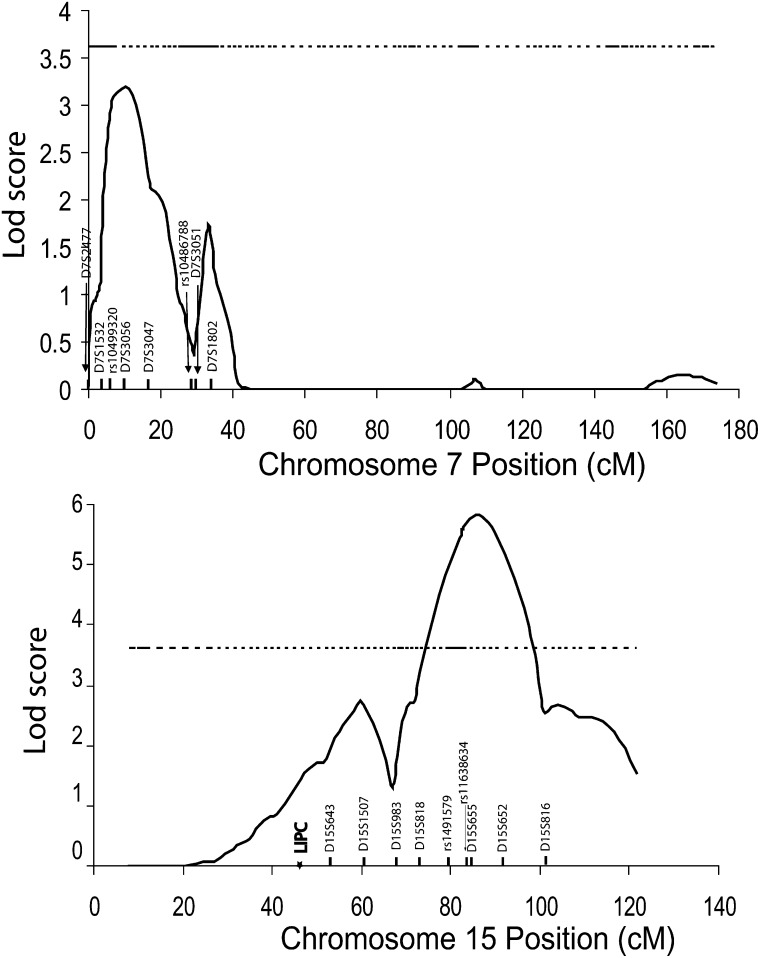
Plasma HDL cholesterol levels (HDL-C) are an independent predictor of coronary artery disease (CAD). We have completed a genome-wide linkage scan for HDL-C in a US cohort consisting of 388 multiplex families with premature CAD (GeneQuest). The heritability of HDL-C in GeneQuest was 0.37 with gender and age as covariates (P = 5.1 x 10(-4)). Two major quantitative trait loci (QTL) for log-transformed HDL-C adjusted for age and gender were identified onto chromosomes 7p22 and 15q25 with maximum multipoint logarithm of odds (LOD) scores of 3.76 and 6.69, respectively. Fine mapping decreased the 7p22 LOD score to a nonsignificant level of 3.09 and split the 15q25 QTL into two loci, one minor QTL on 15q22 (LOD = 2.73) that spanned the LIPC gene, and the other at 15q25 (LOD = 5.63). A family-based quantitative transmission disequilibrium test (QTDT) revealed significant association between variant rs1800588 in LIPC and HDL-C in the GeneQuest population (P = 0.0067), which may account for the minor QTL on 15q22. The 15q25 QTL is the most significant locus identified for HDL-C to date, and these results provide a framework for the ultimate identification of the underlying HDL-C variant and gene on chromosomes 15q25, which will provide insights into novel regulatory mechanisms of HDL-C metabolism.
Figures
Similar articles
-
Genome scan for loci regulating HDL cholesterol levels in Finnish extended pedigrees with early coronary heart disease.Eur J Hum Genet. 2010 May;18(5):604-13. doi: 10.1038/ejhg.2009.202. Epub 2009 Nov 25. Eur J Hum Genet. 2010. PMID: 19935834 Free PMC article.
-
Genome-wide linkage scan for plasma high density lipoprotein cholesterol, apolipoprotein A-1 and triglyceride variation among American Indian populations: the Strong Heart Family Study.J Med Genet. 2009 Jul;46(7):472-9. doi: 10.1136/jmg.2008.063891. Epub 2009 May 7. J Med Genet. 2009. PMID: 19429595 Free PMC article.
-
Genome-wide linkage analysis of lipids in nondiabetic Chinese and Japanese from the SAPPHIRe family study.Am J Hypertens. 2006 Dec;19(12):1270-7. doi: 10.1016/j.amjhyper.2006.05.004. Am J Hypertens. 2006. PMID: 17161774
-
Genetic architecture of coronary artery disease in the genome-wide era: implications for the emerging "golden dozen" loci.Semin Thromb Hemost. 2009 Oct;35(7):671-82. doi: 10.1055/s-0029-1242721. Semin Thromb Hemost. 2009. PMID: 20013534 Review.
-
Quantitative trait loci and candidate genes regulating HDL cholesterol: a murine chromosome map.Arterioscler Thromb Vasc Biol. 2002 Sep 1;22(9):1390-401. doi: 10.1161/01.atv.0000030201.29121.a3. Arterioscler Thromb Vasc Biol. 2002. PMID: 12231556 Review.
Cited by
-
The interaction of ApoA-I and ABCA1 triggers signal transduction pathways to mediate efflux of cellular lipids.Mol Med. 2012 Mar 27;18(1):149-58. doi: 10.2119/molmed.2011.00183. Mol Med. 2012. PMID: 22064972 Free PMC article. Review.
-
Apolipoprotein A-I: insights from redox proteomics for its role in neurodegeneration.Proteomics Clin Appl. 2013 Jan;7(1-2):109-22. doi: 10.1002/prca.201200087. Proteomics Clin Appl. 2013. PMID: 23027708 Free PMC article. Review.
-
The Relationship Between Premature Myocardial Infarction with TC/HDL-C Ratio Subgroups in a Multiple Risk Factor Model.Adv J Emerg Med. 2019 May 12;3(3):e24. doi: 10.22114/ajem.v0i0.149. eCollection 2019 Summer. Adv J Emerg Med. 2019. PMID: 31410401 Free PMC article.
-
Genome-wide linkage scan identifies two novel genetic loci for coronary artery disease: in GeneQuest families.PLoS One. 2014 Dec 8;9(12):e113935. doi: 10.1371/journal.pone.0113935. eCollection 2014. PLoS One. 2014. PMID: 25485937 Free PMC article.
-
Genetic loci for blood lipid levels identified by linkage and association analyses in Caribbean Hispanics.J Lipid Res. 2011 Jul;52(7):1411-9. doi: 10.1194/jlr.P013672. Epub 2011 May 10. J Lipid Res. 2011. PMID: 21558551 Free PMC article.
References
-
- Lloyd-Jones D., Adams R., Carnethon M., De S. G., Ferguson T. B., Flegal K., Ford E., Furie K., Go A., Greenlund K., et al. 2009. Heart disease and stroke statistics–2009 update: a report from the American Heart Association Statistics Committee and Stroke Statistics Subcommittee. Circulation. 119: 480–486. - PubMed
-
- Boden W. E. 2000. High-density lipoprotein cholesterol as an independent risk factor in cardiovascular disease: assessing the data from Framingham to the Veterans Affairs High–Density Lipoprotein Intervention Trial. Am. J. Cardiol. 86: 19L–22L. - PubMed
-
- Wilson P. W., Abbott R. D., Castelli W. P. 1988. High density lipoprotein cholesterol and mortality. The Framingham Heart Study. Arteriosclerosis. 8: 737–741. - PubMed
-
- Genest J. J., McNamara J. R., Salem D. N., Schaefer E. J. 1991. Prevalence of risk factors in men with premature coronary artery disease. Am. J. Cardiol. 67: 1185–1189. - PubMed
-
- Gordon D. J., Probstfield J. L., Garrison R. J., Neaton J. D., Castelli W. P., Knoke J. D., Jacobs D. R., Jr., Bangdiwala S., Tyroler H. A. 1989. High-density lipoprotein cholesterol and cardiovascular disease. Four prospective American studies. Circulation. 79: 8–15. - PubMed
Publication types
MeSH terms
Substances
Grants and funding
LinkOut - more resources
Full Text Sources
Other Literature Sources
Medical
Miscellaneous
