. 2010 Mar;176(3):1256-70.
doi: 10.2353/ajpath.2010.090188. Epub 2010 Jan 14.

Macrophage matrix metalloproteinase-9 mediates epithelial-mesenchymal transition in vitro in murine renal tubular cells

Affiliations

Macrophage matrix metalloproteinase-9 mediates epithelial-mesenchymal transition in vitro in murine renal tubular cells

Thian Kui Tan et al. Am J Pathol. 2010 Mar.

Abstract

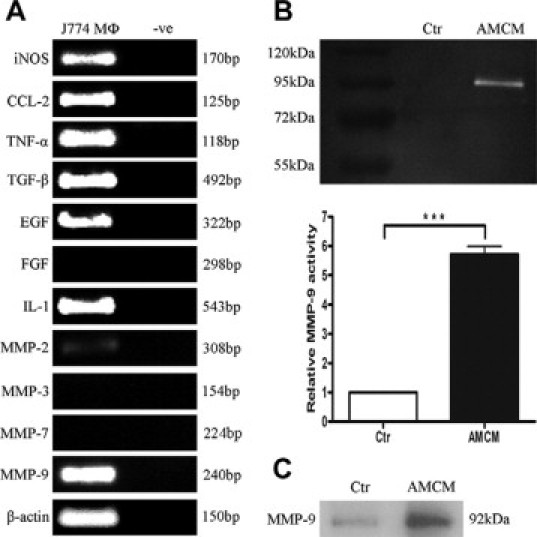
As a rich source of pro-fibrogenic growth factors and matrix metalloproteinases (MMPs), macrophages are well-placed to play an important role in renal fibrosis. However, the exact underlying mechanisms and the extent of macrophage involvement are unclear. Tubular cell epithelial-mesenchymal transition (EMT) is an important contributor to renal fibrosis and MMPs to induction of tubular cell EMT. The aim of this study was to investigate the contribution of macrophages and MMPs to induction of tubular cell EMT. The murine C1.1 tubular epithelial cell line and primary tubular epithelial cells were cultured in activated macrophage-conditioned medium (AMCM) derived from lipopolysaccharide-activated J774 macrophages. MMP-9, but not MMP-2 activity was detected in AMCM. AMCM-induced tubular cell EMT in C1.1 cells was inhibited by broad-spectrum MMP inhibitor (GM6001), MMP-2/9 inhibitor, and in AMCM after MMP-9 removal by monoclonal Ab against MMP-9. AMCM-induced EMT in primary tubular epithelial cells was inhibited by MMP-2/9 inhibitor. MMP-9 induced tubular cell EMT in both C1.1 cells and primary tubular epithelial cells. Furthermore, MMP-9 induced tubular cell EMT in C1.1 cells to an extent similar to transforming growth factor-beta. Transforming growth factor-beta-induced tubular cell EMT in C1.1 cells was inhibited by MMP-2/9 inhibitor. Our in vitro study provides evidence that MMPs, specifically MMP-9, secreted by effector macrophages can induce tubular cell EMT and thereby contribute to renal fibrosis.


Figures

Figure 1
Figure 1
Activated macrophage conditioned medium (AMCM) induced tubular cell EMT in C1.1 cells after 48 hours of treatment. A: Morphological changes in C1.1 cells induced by AMCM were examined by phase contrast microscopy. B: The percentage of spindle-shaped cells in C1.1 cells treated with AMCM was quantified as described in Materials and Methods. C: The expression of E-cadherin, cytokeratin, α-SMA, vimentin, and snail mRNA from C1.1 cells cultured in AMCM were quantified by real-time PCR. Gene expression levels were normalized with β-actin mRNA. D: Indirect immunofluorescence staining for E-cadherin, β-catenin, cytokeratin, α-SMA, vimentin, N-cadherin, and fibronectin were performed in C1.1 cells cultured in AMCM. Isotype control staining was performed on cells positive for epithelial or mesenchymal markers. Cells were counterstained with 4′,6-diamidino-2 phenylindole to visualize nuclei (blue). E: Western blot analysis for E-cadherin, cytokeratin, α-SMA, vimentin, and N-cadherin in C1.1 cells treated with AMCM. β-actin was included as loading control. Figures presented are representative of each of at least three individual replicate experiments. Original magnification ×400. **P < 0.01, ***P < 0.001.
Figure 2
Figure 2
MMP-inhibitor (GM6001) inhibited AMCM-induced tubular cell EMT in C1.1 cells after 48 hours of treatment. A: Morphological changes in C1.1 cells induced by AMCM and in absence or presence of GM6001 were examined by phase contrast microscopy. B: The percentage of spindle-shaped cells observed in C1.1 cells treated with AMCM with or without GM6001 was quantified as described in Materials and Methods. C: Indirect immunofluorescence and (D) Western blot analysis for E-cadherin and α-SMA were performed in C1.1 cells cultured in AMCM with or without GM6001. Original magnification ×400. ***P < 0.001.
Figure 3
Figure 3
J774 macrophages expressed pro-fibrogenic growth factors and matrix metalloproteinases (MMP) after 24 hours of activation with lipopolysaccharide (5 μg/ml). A: Expression of inducible nitric oxide synthase, chemokine (C-C motif) ligand 2, TNF-α, TGF-β, epidermal growth factor, fibroblast growth factor, interleukin-1, MMP-2, MMP-3, MMP-7, and MMP-9 was analyzed by RT-PCR on RNA extracted from activated J774 macrophages. B: MMP-2 and MMP-9 activity in AMCM was determined by gelatin zymography and the relative activity of MMP-9 in AMCM was compared with control DMEM medium. C: Western blot analysis for MMP-9 using immunoprecipitate derived from medium of control and AMCM-treated C1.1 cells after 48 hours of treatment. ***P < 0.001.
Figure 4
Figure 4
Treatment with recombinant MMP-9 (rMMP-9) for 48 hours induced tubular cell EMT in C1.1 cells. A: Morphological changes in C1.1 cells induced by rMMP-9 were examined by phase contrast microscopy. B: The percentage of spindle-shaped cells in C1.1 cells treated with rMMP-9 was quantified as described in Materials and Methods. C: The expression of E-cadherin, cytokeratin, α-SMA, vimentin, and snail mRNA from C1.1 cells treated with rMMP-9 were quantified by real-time PCR. D: Indirect immunofluorescence staining for E-cadherin, β-catenin, cytokeratin, α-SMA, vimentin, N-cadherin, and fibronectin was performed in C1.1 cells treated with rMMP-9. E: Western blot analysis for E-cadherin, cytokeratin, α-SMA, vimentin, and N-cadherin in C1.1 cells treated with rMMP-9. F: Western blot analysis for E-cadherin and α-SMA expression in C1.1 cells treated with rMMP-9 with or without MMP-2/9 inhibitor. G: Western blot analysis for E-cadherin ectodomain using immunoprecipitate derived from medium of C1.1 cells treated with rMMP-9 or rMMP-9 with MMP-2/9 inhibitor. Original magnification ×400. *P < 0.05, **P < 0.01, ***P < 0.001.
Figure 5
Figure 5
Treatment with MMP-2/9 inhibitor for 48 hours inhibited AMCM-induced tubular cell EMT in C1.1 cells in a dose-dependent manner (1, 2, 3, and 4 μmol/L). A: Morphological changes in C1.1 cells induced by AMCM in absence or presence of MMP-2/9 inhibitor were examined by phase contrast microscopy. B: The percentage of spindle-shaped cells observed in C1.1 cells treated with AMCM in absence or presence of MMP-2/9 inhibitor was quantified as described in Materials and Methods. C: Indirect immunofluorescence and (D) Western blot analysis for E-cadherin and α-SMA in C1.1 cells treated by AMCM with or without MMP-2/9 inhibitor. Original magnification ×400. *P < 0.05, **P < 0.01.
Figure 6
Figure 6
Inhibition of AMCM-induced tubular cell EMT in C1.1 cells after MMP-9 removal by immunoprecipitation and by TGF-β neutralizing Ab. A: Morphological changes in C1.1 cells induced by AMCM, AMCM after MMP-9 removal or in presence of TGF-β neutralizing Ab were examined by phase contrast microscopy. B: The percentage of spindle-shaped cells observed in C1.1 cells treated with AMCM, AMCM after MMP-9 removal, or in the presence of TGF-β neutralizing Ab was quantified as described in Materials and Methods. C: Indirect immunofluorescence and (D) Western blot analysis for E-cadherin and α-SMA in C1.1 cells treated with AMCM, AMCM after MMP-9 removal, or in the presence of TGF-β neutralizing Ab. E: MMP-9 activity in AMCM was determined by gelatin zymography before and after MMP-9 removal by immunoprecipitation. The relative activity of MMP-9 in AMCM, before and after MMP-9 removal was compared. Original magnification ×400. *P < 0.05, **P < 0.01.
Figure 7
Figure 7
Macrophage secreted MMP-9 is responsible for the AMCM-induced EMT in C1.1 cells. A: Morphological changes in C1.1 cells induced by TGF-β alone or in the presence of MMP-2/9 inhibitor (2, 3, and 5 μmol/L) were examined under phase contrast microscopy. B: The percentage of spindle-shaped cells observed in C1.1 cells treated with TGF-β alone or in presence of MMP-2/9 inhibitor were quantified as described in Materials and Methods. C: Indirect immunofluorescence and (D) Western blot analysis for E-cadherin and α-SMA in C1.1 cells treated with TGF-β alone or in presence of MMP-2/9 inhibitor. E: Expression of MMP-2 and MMP-9 was analyzed by RT-PCR on RNA extracted from TGF-β treated C1.1 cells. F: MMP-2 and MMP-9 activity in medium derived from TGF-β treated C1.1 cells was determined by gelatin zymography and the relative activity of MMP-9 in the medium was compared with medium derived from C1.1 cells treated with control medium. G: Western blot analysis for MMP-9 using immunoprecipitate derived from medium of control and TGF-β treated C1.1 cells. H: Western blot and RT-PCR analysis for the expression of MMP-9 induced by TGF-β in control and MMP-9 siRNA-transfected C1.1 cells. I: Western blot analysis for E-cadherin and α-SMA expression in control and MMP-9 siRNA-transfected C1.1 cells treated with AMCM. Original magnification ×400. *P < 0.05, **P < 0.01.
Figure 8
Figure 8
rMMP-9- and AMCM-induced tubular cell EMT in primary TECs after 72 hours of treatment. A: Morphological changes and the expression of E-cadherin, β-catenin, cytokeratin, α-SMA, vimentin, N-cadherin, and fibronectin in primary TECs treated with rMMP-9 or AMCM were examined by phase contrast microscopy and indirect immunofluorescence staining, respectively. Isotype control staining was performed on cells positive for epithelial or mesenchymal markers. B: Western blot analysis for E-cadherin, cytokeratin, α-SMA, vimentin, and N-cadherin in primary TECs treated with rMMP-9 or AMCM. C and D: Indirect immunofluorescence and Western blot analysis for E-cadherin and α-SMA expression in primary TECs cultured in AMCM with or without MMP-2/9 inhibitor. Original magnification ×400.
Figure 9
Figure 9
Macrophage colocalized with MMP-9 and α-SMA staining in mouse kidney of unilateral ureteral obstruction. A: Gomori trichrome staining for interstitial fibrosis (blue). B: Single immunofluorescence staining for macrophages (green), MMP-9 (red) and dual staining (yellow) of macrophages with MMP-9. C: Single immunofluorescence staining for α-SMA (green), MMP-9 (red), and colocalization of α-SMA and MMP-9 staining. Original magnification ×400.

Similar articles

Cited by

References

    1. Nikolic-Paterson DJ, Lan HY, Atkins RC. Macrophages in immune injury. In: Neilson EG, Couser WG, editors. Lippincott-Raven; Philadelphia: 1997. pp. 575–592.
    1. Rodriguez-Iturbe B, Pons H, Herrera-Acosta J, Johnson RJ. Role of immunocompetent cells in nonimmune renal diseases. Kidney Int. 2001;59:1626–1640. - PubMed
    1. Van Goor H, Ding G, Kees-Folts D, Grond J, Schreiner GF, Diamond JR. Macrophages and renal disease. Lab Invest. 1994;71:456–464. - PubMed
    1. Hooke DH, Gee DC, Atkins RC. Leukocyte analysis using monoclonal antibodies in human glomerulonephritis. Kidney Int. 1987;31:964–972. - PubMed
    1. Jones CL, Buch S, Post M, McCulloch L, Liu E, Eddy AA. Pathogenesis of interstitial fibrosis in chronic purine aminonucleoside nephrosis. Kidney Int. 1991;40:1020–1031. - PubMed

Publication types

MeSH terms

Substances