

Neuroprotective function of cellular prion protein in a mouse model of amyotrophic lateral sclerosis
- PMID: 20075202
- PMCID: PMC2832160
- DOI: 10.2353/ajpath.2010.090355
Neuroprotective function of cellular prion protein in a mouse model of amyotrophic lateral sclerosis
Abstract
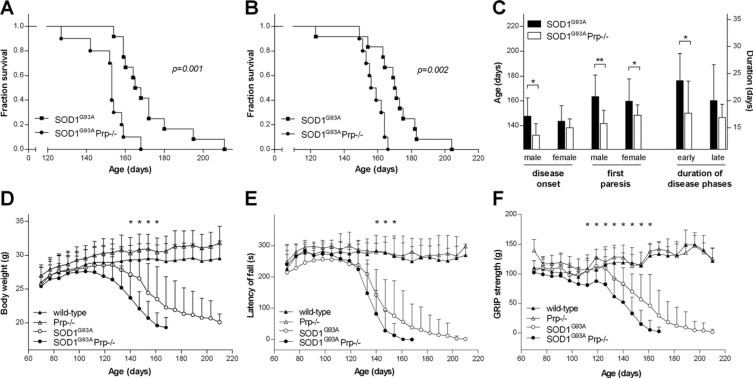
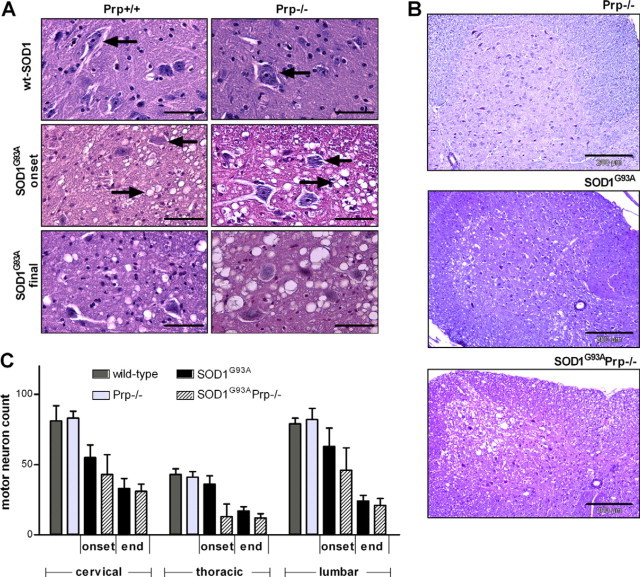
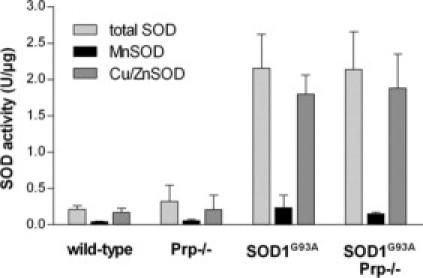
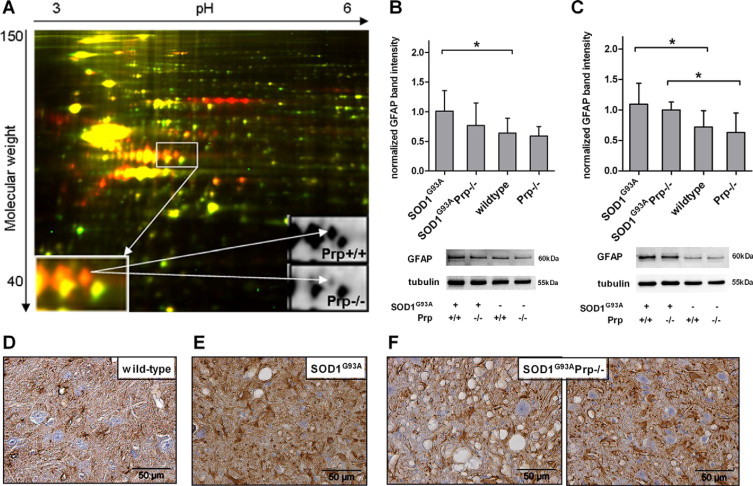
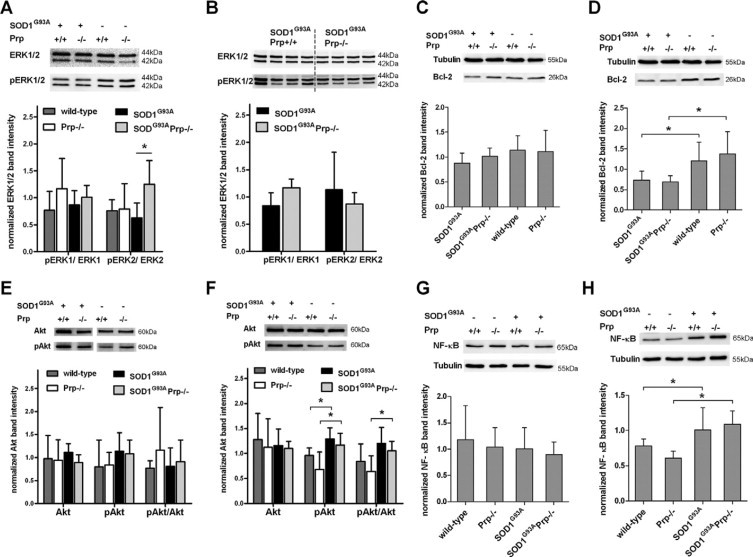
Transgenic mice expressing human mutated superoxide dismutase 1 (SOD1) linked to familial forms of amyotrophic lateral sclerosis are frequently used as a disease model. We used the SOD1G93A mouse in a cross-breeding strategy to study the function of physiological prion protein (Prp). SOD1G93APrp-/- mice exhibited a significantly reduced life span, and an earlier onset and accelerated progression of disease, as compared with SOD1G93APrp+/+ mice. Additionally, during disease progression, SOD1G93APrp-/- mice showed impaired rotarod performance, lower body weight, and reduced muscle strength. Histologically, SOD1G93APrp-/- mice showed reduced numbers of spinal cord motor neurons and extended areas occupied by large vacuoles early in the course of the disease. Analysis of spinal cord homogenates revealed no differences in SOD1 activity. Using an unbiased proteomic approach, a marked reduction of glial fibrillary acidic protein and enhanced levels of collapsing response mediator protein 2 and creatine kinase were detected in SOD1G93APrp-/- versus SOD1G93A mice. In the course of disease, Bcl-2 decreases, nuclear factor-kappaB increases, and Akt is activated, but these changes were largely unaffected by Prp expression. Exclusively in double-transgenic mice, we detected a significant increase in extracellular signal-regulated kinase 2 activation at clinical onset. We propose that Prp has a beneficial role in the SOD1G93A amyotrophic lateral sclerosis mouse model by influencing neuronal and/or glial factors involved in antioxidative defense, rather than anti-apoptotic signaling.
Figures
Similar articles
-
Persistent activation of p38 mitogen-activated protein kinase in a mouse model of familial amyotrophic lateral sclerosis correlates with disease progression.Mol Cell Neurosci. 2003 Jun;23(2):180-92. doi: 10.1016/s1044-7431(03)00022-8. Mol Cell Neurosci. 2003. PMID: 12812752
-
SIRT1 overexpression ameliorates a mouse model of SOD1-linked amyotrophic lateral sclerosis via HSF1/HSP70i chaperone system.Mol Brain. 2014 Aug 29;7:62. doi: 10.1186/s13041-014-0062-1. Mol Brain. 2014. PMID: 25167838 Free PMC article.
-
Human Cu/Zn superoxide dismutase (SOD1) overexpression in mice causes mitochondrial vacuolization, axonal degeneration, and premature motoneuron death and accelerates motoneuron disease in mice expressing a familial amyotrophic lateral sclerosis mutant SOD1.Neurobiol Dis. 2000 Dec;7(6 Pt B):623-43. doi: 10.1006/nbdi.2000.0299. Neurobiol Dis. 2000. PMID: 11114261
-
Neuroprotective effect of oxidized galectin-1 in a transgenic mouse model of amyotrophic lateral sclerosis.Exp Neurol. 2005 Jul;194(1):203-11. doi: 10.1016/j.expneurol.2005.02.011. Exp Neurol. 2005. PMID: 15899257
-
Progesterone and Allopregnanolone Neuroprotective Effects in the Wobbler Mouse Model of Amyotrophic Lateral Sclerosis.Cell Mol Neurobiol. 2022 Jan;42(1):23-40. doi: 10.1007/s10571-021-01118-y. Epub 2021 Jun 17. Cell Mol Neurobiol. 2022. PMID: 34138412 Free PMC article. Review.
Cited by
-
The Quest for Cellular Prion Protein Functions in the Aged and Neurodegenerating Brain.Cells. 2020 Mar 2;9(3):591. doi: 10.3390/cells9030591. Cells. 2020. PMID: 32131451 Free PMC article. Review.
-
Foodborne transmission of bovine spongiform encephalopathy to non-human primates results in preclinical rapid-onset obesity.PLoS One. 2014 Aug 4;9(8):e104343. doi: 10.1371/journal.pone.0104343. eCollection 2014. PLoS One. 2014. PMID: 25090610 Free PMC article.
-
Cytosolic caspases mediate mislocalised SOD2 depletion in an in vitro model of chronic prion infection.Dis Model Mech. 2013 Jul;6(4):952-63. doi: 10.1242/dmm.010678. Epub 2013 Apr 4. Dis Model Mech. 2013. PMID: 23580200 Free PMC article.
-
Cellular prion protein regulates its own α-cleavage through ADAM8 in skeletal muscle.J Biol Chem. 2012 May 11;287(20):16510-20. doi: 10.1074/jbc.M112.360891. Epub 2012 Mar 23. J Biol Chem. 2012. PMID: 22447932 Free PMC article.
-
Protease-resistant SOD1 aggregates in amyotrophic lateral sclerosis demonstrated by paraffin-embedded tissue (PET) blot.Acta Neuropathol Commun. 2014 Aug 28;2:130. doi: 10.1186/s40478-014-0130-x. Acta Neuropathol Commun. 2014. PMID: 25159221 Free PMC article.
References
-
- Leigh PN, Swash M, Iwasaki Y, Ludolph A, Meininger V, Miller RG, Mitsumoto H, Shaw P, Tashiro K, Van Den Berg L. Amyotrophic lateral sclerosis: a consensus viewpoint on designing and implementing a clinical trial. Amyotroph Lateral Scler Other Motor Neuron Disord. 2004;5:84–98. - PubMed
-
- Kabashi E, Valdmanis PN, Dion P, Rouleau GA. Oxidized/misfolded superoxide dismutase-1: the cause of all amyotrophic lateral sclerosis? Ann Neurol. 2007;62:553–559. - PubMed
-
- Urushitani M, Sik A, Sakurai T, Nukina N, Takahashi R, Julien JP. Chromogranin-mediated secretion of mutant superoxide dismutase proteins linked to amyotrophic lateral sclerosis. Nat Neurosci. 2006;9:108–118. - PubMed
-
- Kostic V, Jackson-Lewis V, de Bilbao F, Dubois-Dauphin M, Przedborski S. Bcl-2: prolonging life in a transgenic mouse model of familial amyotrophic lateral sclerosis. Science. 1997;277:559–562. - PubMed
Publication types
MeSH terms
Substances
LinkOut - more resources
Full Text Sources
Other Literature Sources
Medical
Molecular Biology Databases
Research Materials
Miscellaneous
