

Preeclampsia: 2-methoxyestradiol induces cytotrophoblast invasion and vascular development specifically under hypoxic conditions
- PMID: 20075204
- PMCID: PMC2808078
- DOI: 10.2353/ajpath.2010.090513
Preeclampsia: 2-methoxyestradiol induces cytotrophoblast invasion and vascular development specifically under hypoxic conditions
Abstract
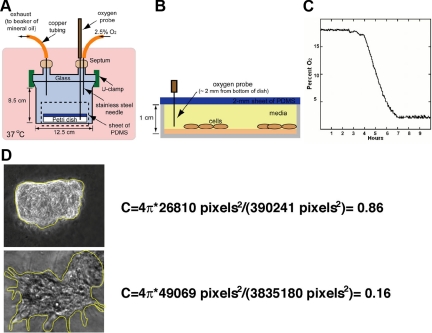
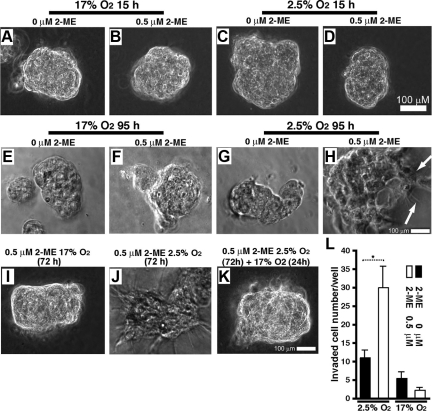
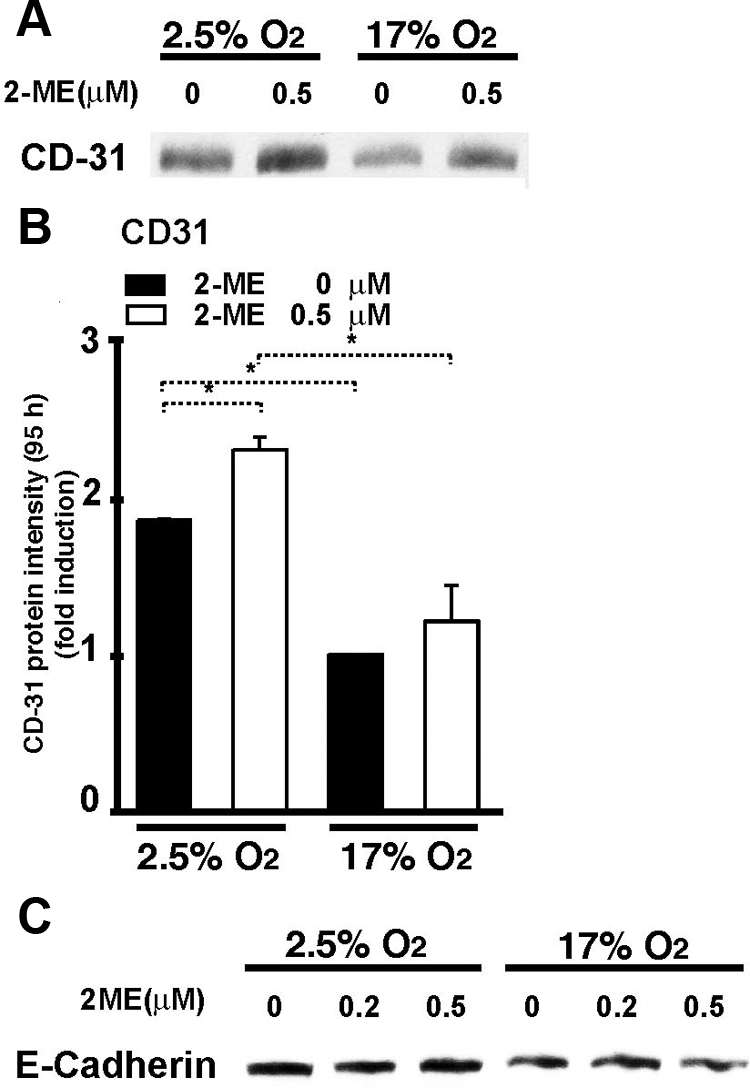
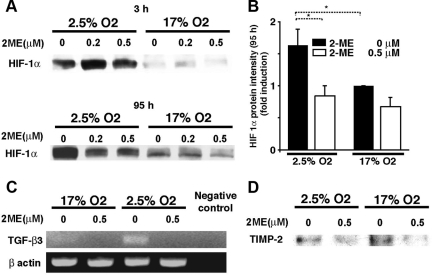
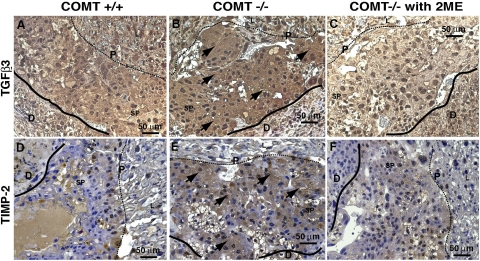
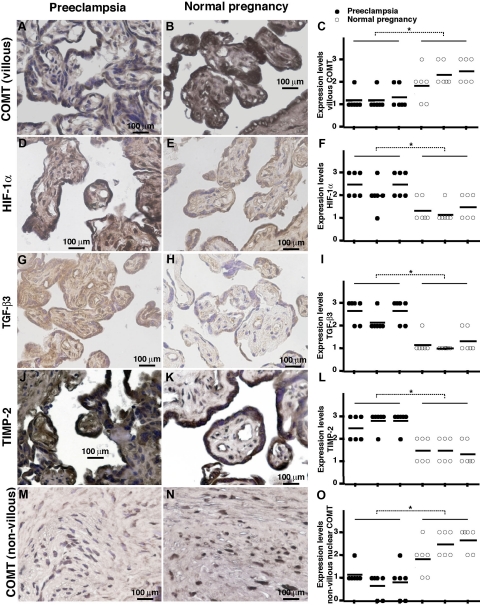
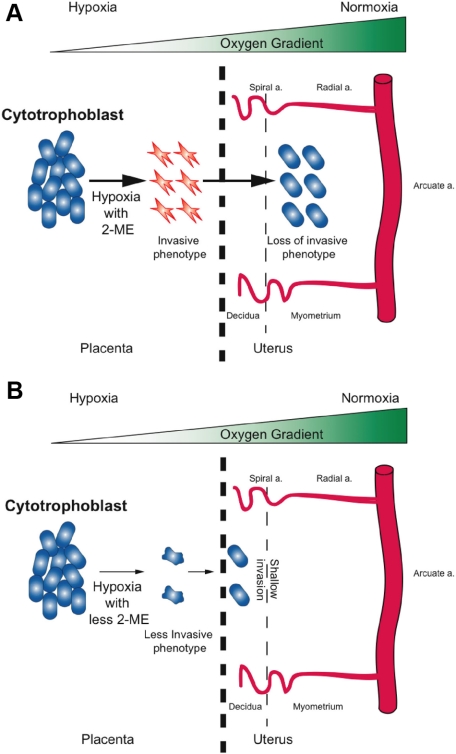
Inadequate invasion of the uterus by cytotrophoblasts is speculated to result in pregnancy-induced disorders such as preeclampsia. However, the molecular mechanisms that govern appropriate invasion of cytotrophoblasts are unknown. Here, we demonstrate that under low-oxygen conditions (2.5% oxygen), 2-methoxyestradiol (2-ME), which is a metabolite of estradiol and is generated by catechol-o-methyltransferase (COMT), induces invasion of cytotrophoblasts into a naturally-derived, extracellular matrix. Neither low-oxygen conditions nor 2-ME alone induces the invasion of cytotrophoblasts in this system; however, low-oxygen conditions combined with 2-ME result in the appropriate invasion of cytotrophoblasts into the extracellular matrix. Cytotrophoblast invasion under these conditions is also associated with a decrease in the expression of hypoxia-inducible factor-1alpha (HIF-1alpha), transforming growth factor-beta3 (TGF-beta3), and tissue inhibitor of metalloproteinases-2 (TIMP-2). Pregnant COMT-deficient mice with hypoxic placentas and preeclampsia-like features demonstrate an up-regulation of HIF-1alpha, TGF-beta3, and TIMP-2 when compared with wild-type mice; normal levels are restored on administration of 2-ME, which also results in the resolution of preeclampsia-like features in these mice. Indeed, placentas from patients with preeclampsia reveal lower levels of COMT and higher levels of HIF-1alpha, TGF-beta3, and TIMP-2 when compared with those from normal pregnant women. We demonstrate that low-oxygen conditions of the placenta are a critical co-stimulator along with 2-ME for the proper invasion of cytotrophoblasts to facilitate appropriate vascular development and oxygenation during pregnancy.
Figures
Similar articles
-
Decreased maternal serum 2-methoxyestradiol levels are associated with the development of preeclampsia.Cell Physiol Biochem. 2014;34(6):2189-99. doi: 10.1159/000369662. Epub 2014 Dec 4. Cell Physiol Biochem. 2014. PMID: 25562165
-
Metabolic pathways involved in 2-methoxyestradiol synthesis and their role in preeclampsia.Reprod Sci. 2013 Sep;20(9):1020-9. doi: 10.1177/1933719113477483. Epub 2013 Mar 1. Reprod Sci. 2013. PMID: 23456663 Free PMC article. Review.
-
Deficiency in catechol-O-methyltransferase and 2-methoxyoestradiol is associated with pre-eclampsia.Nature. 2008 Jun 19;453(7198):1117-21. doi: 10.1038/nature06951. Epub 2008 May 11. Nature. 2008. PMID: 18469803
-
Hypoxia induced HIF-1/HIF-2 activity alters trophoblast transcriptional regulation and promotes invasion.Eur J Cell Biol. 2015 Dec;94(12):589-602. doi: 10.1016/j.ejcb.2015.10.004. Epub 2015 Oct 24. Eur J Cell Biol. 2015. PMID: 26531845
-
Why is placentation abnormal in preeclampsia?Am J Obstet Gynecol. 2015 Oct;213(4 Suppl):S115-22. doi: 10.1016/j.ajog.2015.08.042. Am J Obstet Gynecol. 2015. PMID: 26428489 Free PMC article. Review.
Cited by
-
Downregulated Krüppel-like factor 8 is involved in decreased trophoblast invasion under hypoxia-reoxygenation conditions.Reprod Sci. 2014 Jan;21(1):72-81. doi: 10.1177/1933719113488448. Epub 2013 May 23. Reprod Sci. 2014. PMID: 23703536 Free PMC article.
-
The c-Myc-regulated microRNA-17~92 (miR-17~92) and miR-106a~363 clusters target hCYP19A1 and hGCM1 to inhibit human trophoblast differentiation.Mol Cell Biol. 2013 May;33(9):1782-96. doi: 10.1128/MCB.01228-12. Epub 2013 Feb 25. Mol Cell Biol. 2013. PMID: 23438603 Free PMC article.
-
Diabetic angiopathy and angiogenic defects.Fibrogenesis Tissue Repair. 2012 Aug 1;5(1):13. doi: 10.1186/1755-1536-5-13. Fibrogenesis Tissue Repair. 2012. PMID: 22853690 Free PMC article.
-
Preeclampsia, hypoxia, thrombosis, and inflammation.J Pregnancy. 2012;2012:374047. doi: 10.1155/2012/374047. Epub 2011 Dec 11. J Pregnancy. 2012. PMID: 22175023 Free PMC article. Review.
-
Hypoxia-induced Downregulation of SRC-3 Suppresses Trophoblastic Invasion and Migration Through Inhibition of the AKT/mTOR Pathway: Implications for the Pathogenesis of Preeclampsia.Sci Rep. 2019 Jul 17;9(1):10349. doi: 10.1038/s41598-019-46699-3. Sci Rep. 2019. PMID: 31316078 Free PMC article.
References
-
- Cross JC, Werb Z, Fisher SJ. Implantation and the placenta: key pieces of the development puzzle. Science. 1994;266:1508–1518. - PubMed
-
- Strickland S, Richards WG. Invasion of the trophoblasts. Cell. 1992;71:355–357. - PubMed
-
- Bischof P, Irminger-Finger I. The human cytotrophoblastic cell, a mononuclear chameleon. Int J Biochem Cell Biol. 2005;37:1–16. - PubMed
Publication types
MeSH terms
Substances
Grants and funding
LinkOut - more resources
Full Text Sources
Molecular Biology Databases
Research Materials
Miscellaneous
