

A comparison of regression techniques for a two-dimensional sensorimotor rhythm-based brain-computer interface
- PMID: 20075503
- PMCID: PMC3446205
- DOI: 10.1088/1741-2560/7/1/016003
A comparison of regression techniques for a two-dimensional sensorimotor rhythm-based brain-computer interface
Abstract
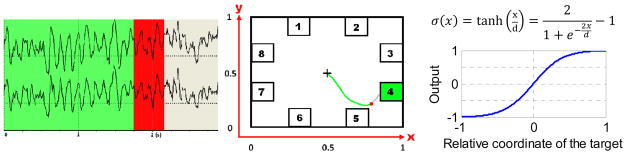
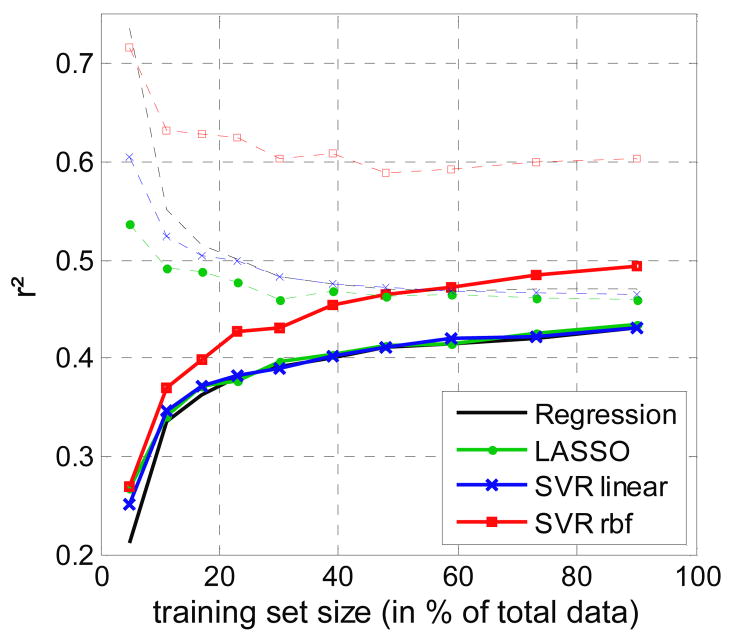
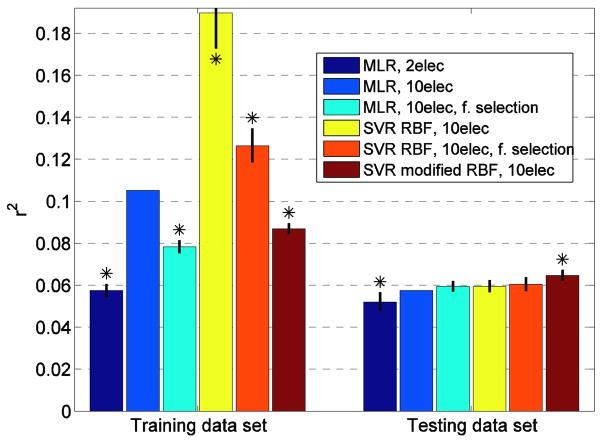
People can learn to control electroencephalogram (EEG) features consisting of sensorimotor-rhythm amplitudes and use this control to move a cursor in one, two or three dimensions to a target on a video screen. This study evaluated several possible alternative models for translating these EEG features into two-dimensional cursor movement by building an offline simulation using data collected during online performance. In offline comparisons, support-vector regression (SVM) with a radial basis kernel produced somewhat better performance than simple multiple regression, the LASSO or a linear SVM. These results indicate that proper choice of a translation algorithm is an important factor in optimizing brain-computer interface (BCI) performance, and provide new insight into algorithm choice for multidimensional movement control.
Figures
Similar articles
-
Sensorimotor rhythm-based brain-computer interface (BCI): feature selection by regression improves performance.IEEE Trans Neural Syst Rehabil Eng. 2005 Sep;13(3):372-9. doi: 10.1109/TNSRE.2005.848627. IEEE Trans Neural Syst Rehabil Eng. 2005. PMID: 16200760 Clinical Trial.
-
Sensorimotor rhythm-based brain-computer interface (BCI): model order selection for autoregressive spectral analysis.J Neural Eng. 2008 Jun;5(2):155-62. doi: 10.1088/1741-2560/5/2/006. Epub 2008 Apr 22. J Neural Eng. 2008. PMID: 18430974 Free PMC article.
-
Conversion of EEG activity into cursor movement by a brain-computer interface (BCI).IEEE Trans Neural Syst Rehabil Eng. 2004 Sep;12(3):331-8. doi: 10.1109/TNSRE.2004.834627. IEEE Trans Neural Syst Rehabil Eng. 2004. PMID: 15473195 Clinical Trial.
-
Brain-computer interface research at the wadsworth center developments in noninvasive communication and control.Int Rev Neurobiol. 2009;86:147-57. doi: 10.1016/S0074-7742(09)86011-X. Int Rev Neurobiol. 2009. PMID: 19607997 Review.
-
Brain-computer interface signal processing at the Wadsworth Center: mu and sensorimotor beta rhythms.Prog Brain Res. 2006;159:411-9. doi: 10.1016/S0079-6123(06)59026-0. Prog Brain Res. 2006. PMID: 17071245 Review.
Cited by
-
Adaptive Laplacian filtering for sensorimotor rhythm-based brain-computer interfaces.J Neural Eng. 2013 Feb;10(1):016002. doi: 10.1088/1741-2560/10/1/016002. Epub 2012 Dec 10. J Neural Eng. 2013. PMID: 23220879 Free PMC article.
-
Automatic and adaptive classification of electroencephalographic signals for brain computer interfaces.J Med Syst. 2012 Nov;36 Suppl 1:S51-63. doi: 10.1007/s10916-012-9893-4. Epub 2012 Nov 2. J Med Syst. 2012. PMID: 23117792
-
Decoding unconstrained arm movements in primates using high-density electrocorticography signals for brain-machine interface use.Sci Rep. 2018 Jul 12;8(1):10583. doi: 10.1038/s41598-018-28940-7. Sci Rep. 2018. PMID: 30002452 Free PMC article.
-
Brain-computer interface based on generation of visual images.PLoS One. 2011;6(6):e20674. doi: 10.1371/journal.pone.0020674. Epub 2011 Jun 10. PLoS One. 2011. PMID: 21695206 Free PMC article.
-
Audio-visual feedback for electromyographic control of vowel synthesis.Annu Int Conf IEEE Eng Med Biol Soc. 2012;2012:3600-3. doi: 10.1109/EMBC.2012.6346745. Annu Int Conf IEEE Eng Med Biol Soc. 2012. PMID: 23366706 Free PMC article.
References
-
- Albert NB, Weigelt M, Hazeltine E, Ivry RB. Target selection during bimanual reaching to direct cues is unaffected by the perceptual similarity of targets. Journal of Experimental Psychology. 2007;33:1107–1116. - PubMed
-
- Birbaumer N, Ghanayim N, Hinterberger T, Iversen I, Kotchoubey B, Kubler A, Perlmouter J, Taub E, Flor H. A spelling device for the paralyzed. Nature. 1999;398:297–298. - PubMed
-
- Blankertz B, Muller K-R, Krusienski DJ, Schalk G, Wolpaw JR, Schlogl A, Pfurtscheller G, Millan JR, Schroder M, Birbaumer N. The BCI Competition III: Validating alternative approaches to actual BCI problems. IEEE Transactions on Neural Systems and Rehabilitation Engineering. 2006;14:153–159. - PubMed
-
- Blum A, Langley P. Selection of relevant features and examples in machine learning. Artificial Intelligence. 1997;97:245–271.
-
- Efron B, Tibshirani R. An introduction to the bootstrap. Chapman & Hall; 1993.
Publication types
MeSH terms
Grants and funding
LinkOut - more resources
Full Text Sources