

WebParc: a tool for analysis of the topography and volume of stroke from MRI
- PMID: 20077026
- PMCID: PMC2848120
- DOI: 10.1007/s11517-009-0571-8
WebParc: a tool for analysis of the topography and volume of stroke from MRI
Abstract
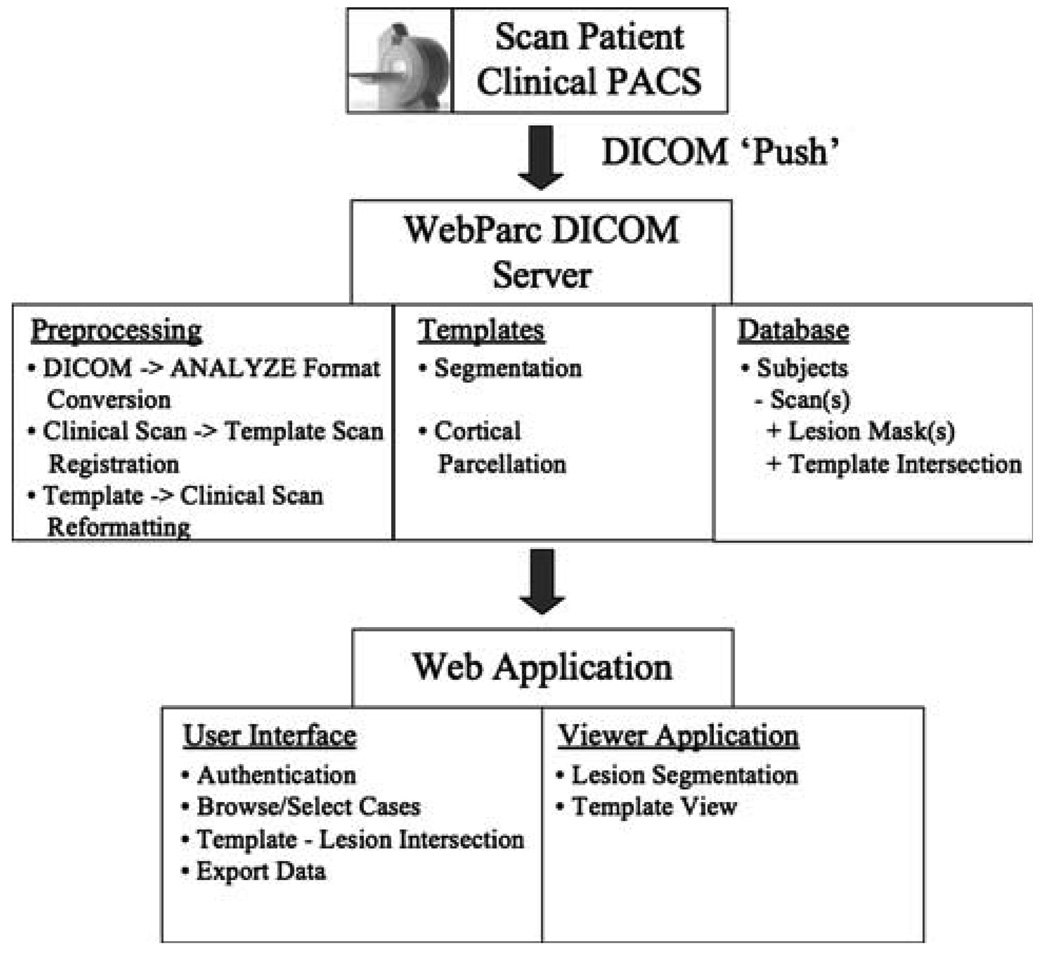
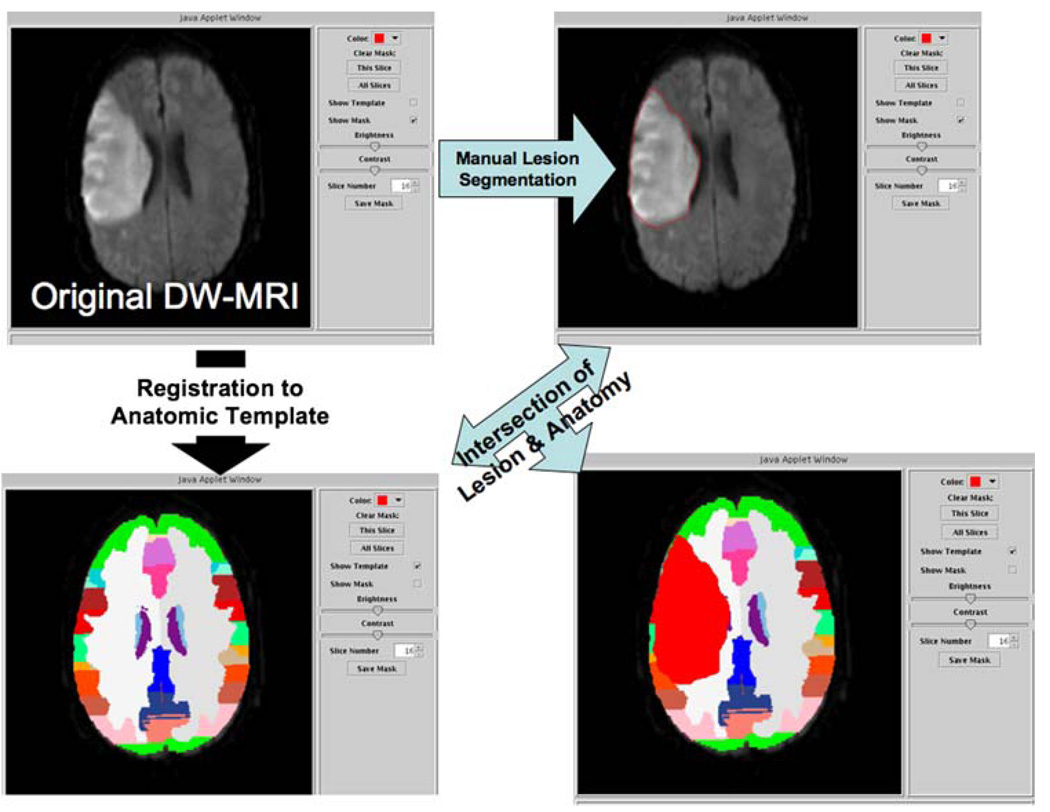
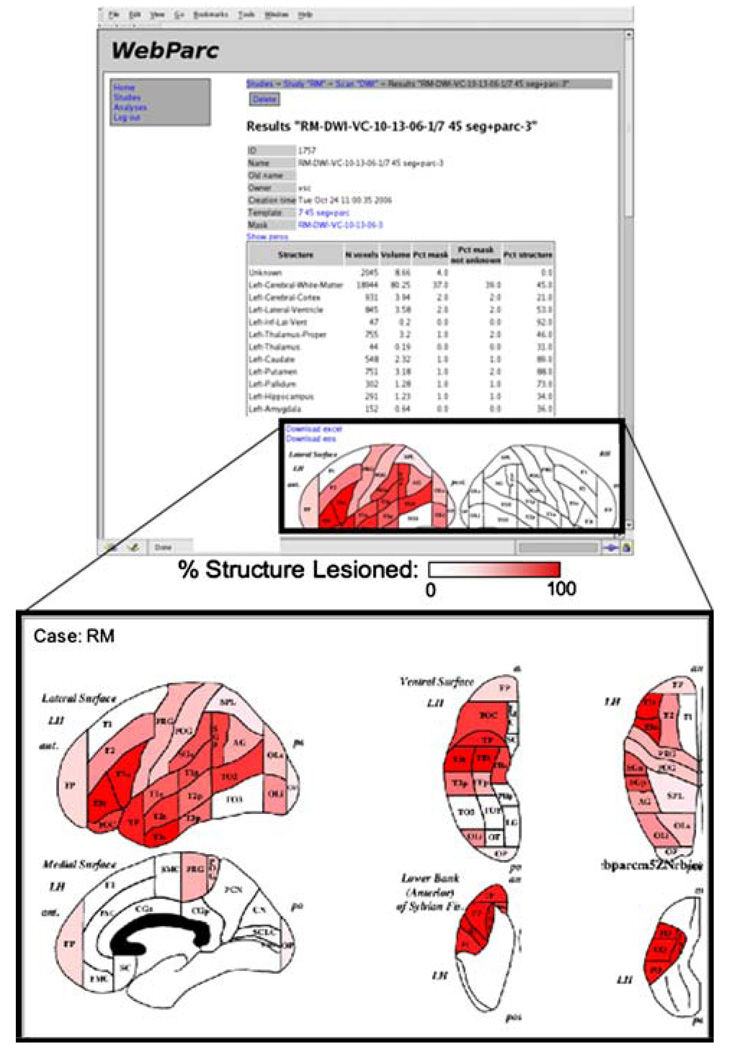
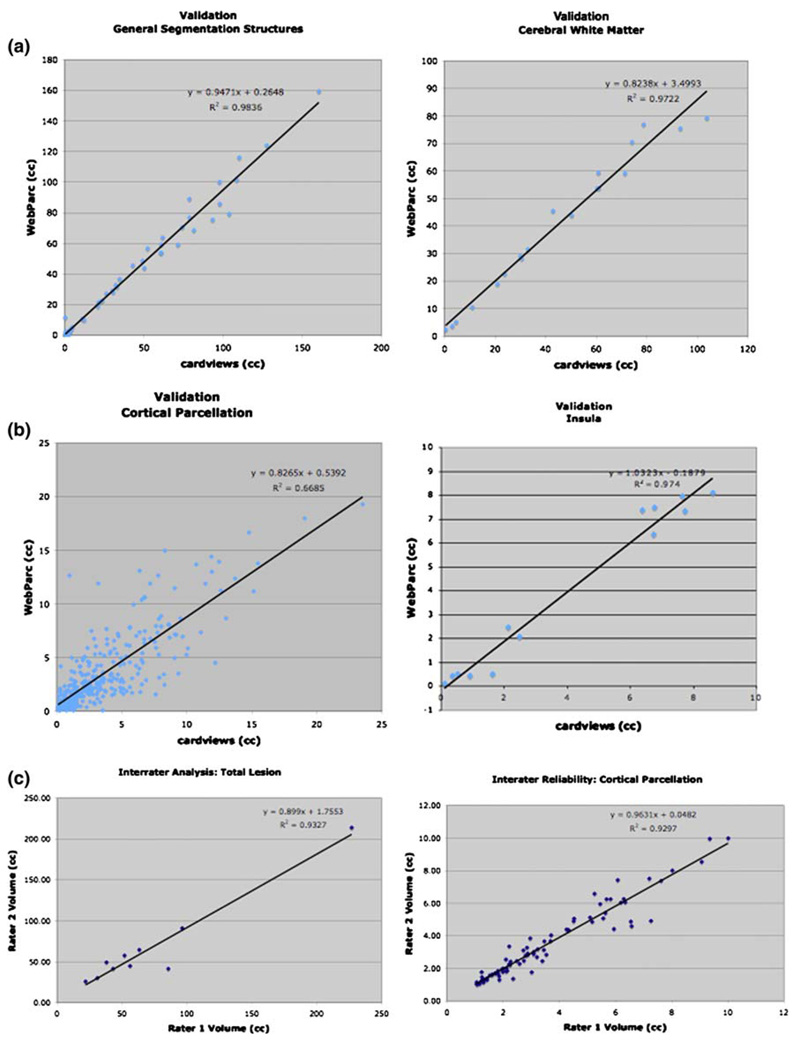
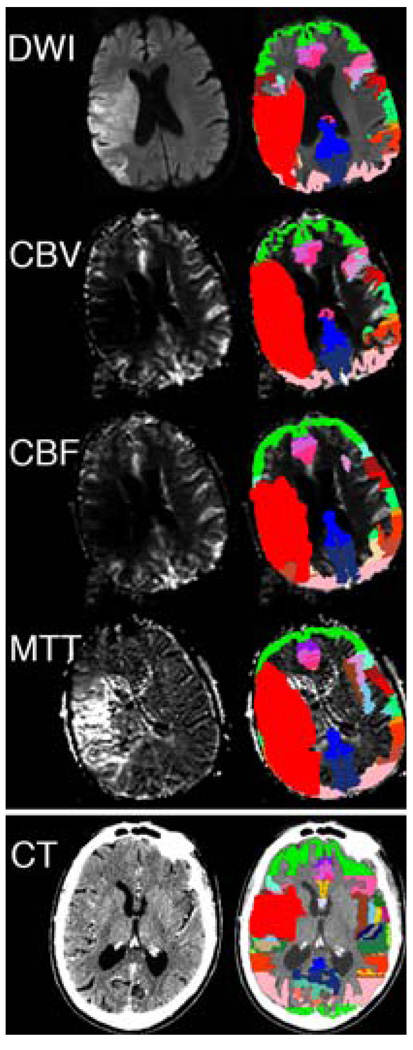
The quantitative assessment of the anatomic consequences of cerebral infarction is critical in the study of the etiology and therapeutic response in patients with stroke. We present here an overview of the operation of "WebParc," a computational system that provides measures of stroke lesion volume and location with respect to canonical forebrain neural systems nomenclature. Using a web-based interface, clinical imaging data can be registered to a template brain that contains a comprehensive set of anatomic structures. Upon delineation of the lesion, we can express the size and localization of the lesion in terms of the regions that are intersected within the template. We demonstrate the application of the system using MRI-based diffusion-weighted imaging and document measures of the validity and reliability of its uses. Intra- and inter-rater reliability is demonstrated, and characterized relative to the various classes of anatomic regions that can be assessed. The WebParc system has been developed to meet criteria of both efficiency and intuitive operator use in the real time analysis of stroke anatomy, so as to be useful in support of clinical care and clinical research studies. This article is an overview of its base-line operation with quantitative anatomic characterization of lesion size and location in terms of stroke distribution within the separate gray and white matter compartments of the brain.
Figures
Similar articles
-
Big Data Approaches to Phenotyping Acute Ischemic Stroke Using Automated Lesion Segmentation of Multi-Center Magnetic Resonance Imaging Data.Stroke. 2019 Jul;50(7):1734-1741. doi: 10.1161/STROKEAHA.119.025373. Epub 2019 Jun 10. Stroke. 2019. PMID: 31177973 Free PMC article.
-
Cerebral magnetic resonance imaging within 6 hours of stroke onset: inter- and intra-observer reproducibility.Cerebrovasc Dis. 2003;16(2):122-7. doi: 10.1159/000070591. Cerebrovasc Dis. 2003. PMID: 12792169
-
Visual assessment of magnetic resonance imaging perfusion lesions in a large patient group.Clin Neuroradiol. 2012 Dec;22(4):305-13. doi: 10.1007/s00062-012-0143-4. Epub 2012 Apr 8. Clin Neuroradiol. 2012. PMID: 22484907
-
Diffusion tensor imaging (DTI)-based white matter mapping in brain research: a review.J Mol Neurosci. 2008;34(1):51-61. doi: 10.1007/s12031-007-0029-0. J Mol Neurosci. 2008. PMID: 18157658 Review.
-
Susceptibility-weighted imaging and quantitative susceptibility mapping in the brain.J Magn Reson Imaging. 2015 Jul;42(1):23-41. doi: 10.1002/jmri.24768. Epub 2014 Oct 1. J Magn Reson Imaging. 2015. PMID: 25270052 Free PMC article. Review.
Cited by
-
RayPlus: a Web-Based Platform for Medical Image Processing.J Digit Imaging. 2017 Apr;30(2):197-203. doi: 10.1007/s10278-016-9920-y. J Digit Imaging. 2017. PMID: 27904975 Free PMC article.
-
Taxonomy of Acute Stroke: Imaging, Processing, and Treatment.Diagnostics (Basel). 2024 May 19;14(10):1057. doi: 10.3390/diagnostics14101057. Diagnostics (Basel). 2024. PMID: 38786355 Free PMC article. Review.
-
A CAD System for Hemorrhagic Stroke.Neuroradiol J. 2014 Sep;27(4):409-16. doi: 10.15274/NRJ-2014-10080. Epub 2014 Aug 29. Neuroradiol J. 2014. PMID: 25196612 Free PMC article.
References
-
- Sorensen AG, Wu O, Copen WA, Davis TL, Gonzalez RG, Koroshetz WJ, Reese TG, Rosen BR, Wedeen VJ, Weisskoff RM. Human acute cerebral ischemia: detection of changes in water diffusion anisotropy by using MR imaging. Radiology. 1999;212:785–792. - PubMed
-
- Sorensen AG, Copen WA, Ostergaard L, Buonanno FS, Gonzalez RG, Rordorf G, Rosen BR, Schwamm LH, Weisskoff RM, Koroshetz WJ. Hyperacute stroke: simultaneous measurement of relative cerebral blood volume, relative cerebral blood flow, and mean tissue transit time. Radiology. 1999;210:519–527. - PubMed
-
- Schwamm LH, Koroshetz WJ, Sorensen AG, Wang B, Copen WA, Budzik R, Rordorf G, Buonanno FS, Schaefer PW, Gonzalez RG. Time course of lesion development in patients with acute stroke: serial diffusion- and hemodynamic-weighted magnetic resonance imaging. Stroke. 1998;29:2268–2276. - PubMed
-
- Rivers CS, Wardlaw JM, Armitage PA, Bastin ME, Carpenter TK, Cvoro V, Hand PJ, Dennis MS. Do acute diffusion-and perfusion-weighted MRI lesions identify final infarct volume in ischemic stroke? Stroke. 2006;37:98–104. - PubMed
Publication types
MeSH terms
Grants and funding
LinkOut - more resources
Full Text Sources
Medical
