. 2010 Mar;239(3):987-97.
doi: 10.1002/dvdy.22218.

Brain phenotypes in two FGFR2 mouse models for Apert syndrome

Affiliations

Brain phenotypes in two FGFR2 mouse models for Apert syndrome

Kristina Aldridge et al. Dev Dyn. 2010 Mar.

Abstract

Apert syndrome (AS) is one of at least nine disorders considered members of the fibroblast growth factor receptor (FGFR) -1, -2, and -3-related craniosynostosis syndromes. Nearly 100% of individuals diagnosed with AS carry one of two neighboring mutations on Fgfr2. The cranial phenotype associated with these two mutations includes coronal suture synostosis, either unilateral (unicoronal synostosis) or bilateral (bicoronal synostosis). Brain dysmorphology associated with AS is thought to be secondary to cranial vault or base alterations, but the variation in brain phenotypes within Apert syndrome is unexplained. Here, we present novel three-dimensional data on brain phenotypes of inbred mice at postnatal day 0 each carrying one of the two Fgfr2 mutations associated with AS. Our data suggest that the brain is primarily affected, rather than secondarily responding to skull dysmorphogenesis. Our hypothesis is that the skull and brain are both primarily affected in craniosynostosis and that shared phenogenetic developmental processes affect both tissues in craniosynostosis of Apert syndrome.


Figures

Fig. 1
Fig. 1
Landmarks collected from magnetic resonance microscopy (MRM) images of postnatal day (P) 0 mouse brains illustrated on three-dimensional (3D) reconstructions of the MRM images. A: Dorsal view. B: Lateral view of right side. C: Midsagittal view. D: Axial slice. Landmark definitions are in Table 1.
Fig. 2
Fig. 2
Comparisons of brain size as measured by the geometric mean of all possible linear distances among Fgfr2+/S252W, Fgfr2+/P253R, and wild-type littermates. Closed triangles, Fgfr2+/S252W; open triangles, Fgfr2+/P253R; circles, wild-type (wt) littermates. Bars = median values.
Fig. 3
Fig. 3
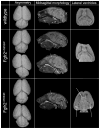
Three-dimensional reconstructions of superior surfaces (first column), midsagittal planes (second column), and axial slice images (last column) of magnetic resonance microscopy (MRM) data, illustrating examples of variation in brain phenotypes. Row 1: Wild-type mouse. Row 2: Fgfr2+/S252W mice with slight cerebral asymmetry (above) and severe cerebral asymmetry (below), enlarged fourth ventricle (above, white arrow) and arched corpus callosum (below, white arrow), and unremarkable lateral ventricles. Row 3: Fgfr2+/P253R mice with slight cerebral asymmetry (above) and severe cerebral asymmetry (below), enlarged fourth ventricle and arched corpus callosum (white arrows) and enlarged lateral ventricles (white arrows).
Fig. 4
Fig. 4
Results of PCOORD analyses of landmark coordinate data collected from brain structures, including Fgfr2+/S252W, Fgfr2+/P253R, and wild-type littermate mice. A: Eigenscores plotted for the first three principal axes and the percent of variation accounted for by each axis. Closed triangles, Fgfr2+/S252W mice; open triangles, Fgfr2+/P253R mice; circles, respective wild-type littermates. B: Linear distances strongly positively correlated with Axis 1. C: Linear distances strongly correlated with Axis 2. Black lines, strong positive correlations; white lines, strong negative correlations. Black dots, landmarks located in plane of view; white dots, landmarks deep to the plane of view.
Fig. 5
Fig. 5
Results of PCOORD analyses of landmark coordinate data collected from brain structures, including only Fgfr2+/S252W (red triangles) and Fgfr2+/P253R (blue triangles) mice. Eigenscores plotted for the first three principal axes and the percent of variation accounted for by each axis. Darkness of each half of the symbols indicate the pattern of coronal suture fusion for that individual (left–right), where dark blue/red indicate complete fusion, light blue/red indicate partial fusion, and white = patent suture.
Fig. 6
Fig. 6
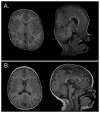
A,B: Example MRIs of a child with AS (A) and a typically developing child (B). Cerebral asymmetry is observed in the axial plane of A (left image) as compared to B. The frequently observed arched corpus callosum is observed in the sagittal plan of A (right image). Compare with arched corpus callosum in Fgfr2+/S252W and Fgfr2+/P253R mice illustrated in Figure 3.

References

    1. Aldridge K, Marsh J, Govier D, Richtsmeier J. Central nervous system phenotypes in craniosynostosis. J Anat. 2002;201:31–39. - PMC - PubMed
    1. Aldridge K, Kane A, Marsh J, Panchal J, Boyadijiev S, Yan P, Govier D, Ahmad W, Richtsmeier J. Brain morphology in nonsyndromic unicoronal craniosynostosis. Anat Rec. 2005;285:690–698. - PubMed
    1. Aldridge K, Kane A, Marsh J, Yan P, Govier D, Richtsmeier J. Relationship of brain and skull in pre- and postoperative sagittal synostosis. J Anat. 2006;206:373–385. - PMC - PubMed
    1. Aldridge K, Reeves R, Olson L, Richtsmeier J. Differential effects of trisomy on brain shape and volume in related aneuploid mouse models. Am J Med Genet Part A. 2007;143A:1060–1070. - PMC - PubMed
    1. Anderson P, Netherway D, Abbott A, Cox T, Roscioli T, David D. Analysis of intracranial volume in Apert syndrome genotypes. Pediatr Neurosurg. 2004;40:161–164. - PubMed

Publication types

Substances

LinkOut - more resources