

The roles of apoptotic pathways in the low recovery rate after cryopreservation of dissociated human embryonic stem cells
- PMID: 20077485
- PMCID: PMC3596802
- DOI: 10.1002/btpr.368
The roles of apoptotic pathways in the low recovery rate after cryopreservation of dissociated human embryonic stem cells
Abstract
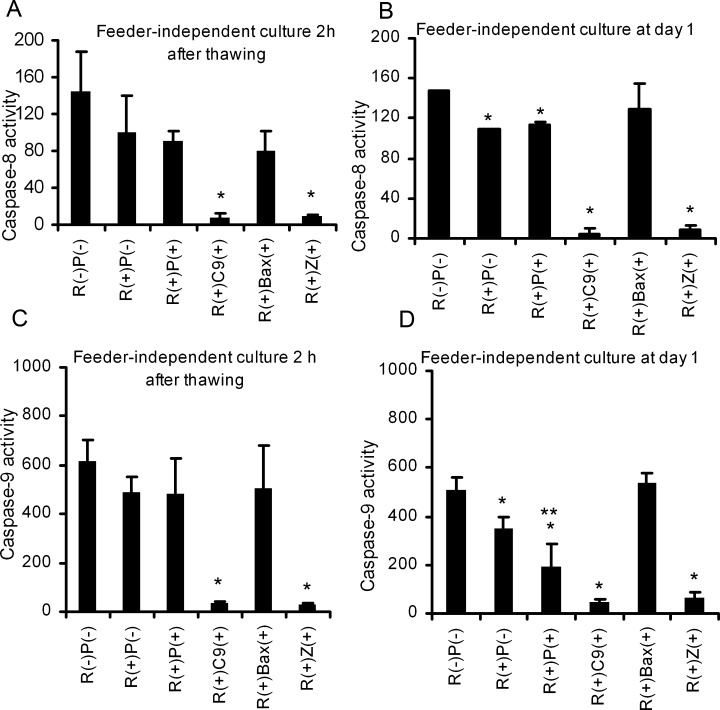
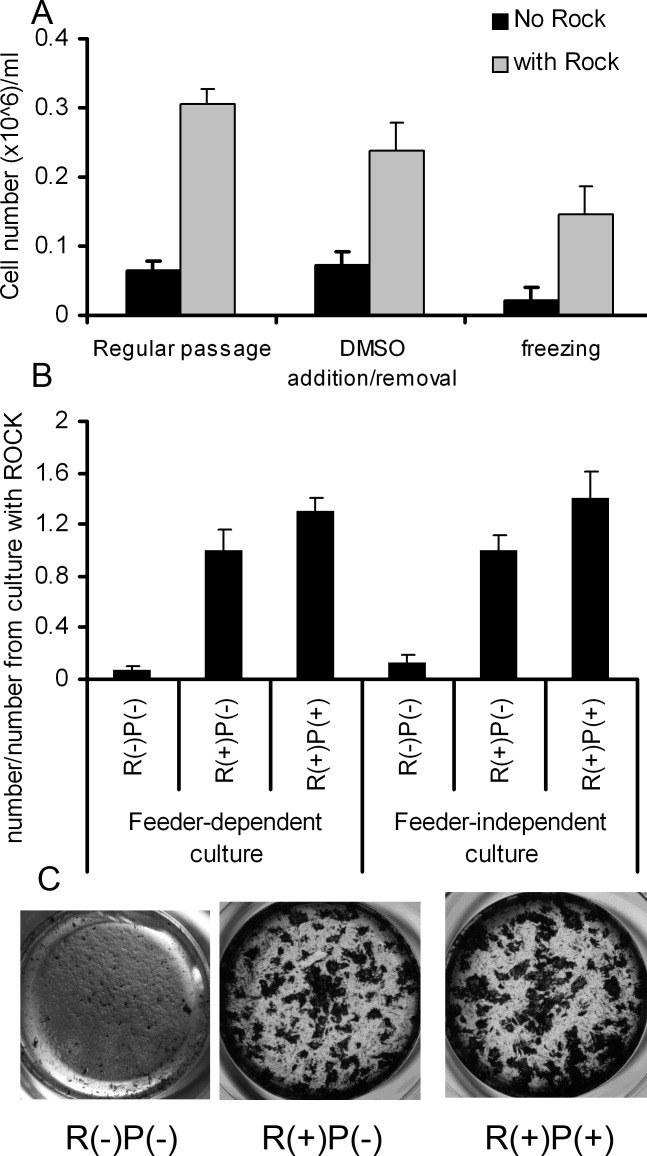
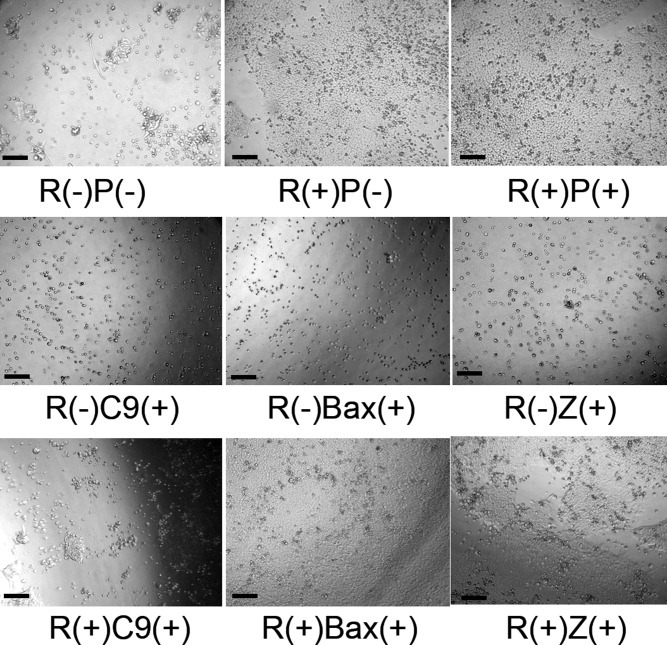
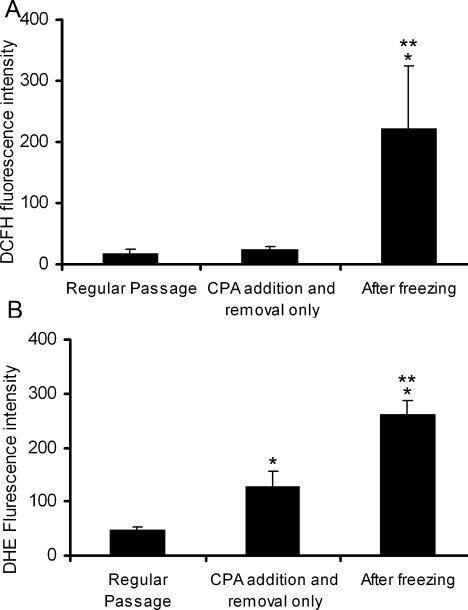
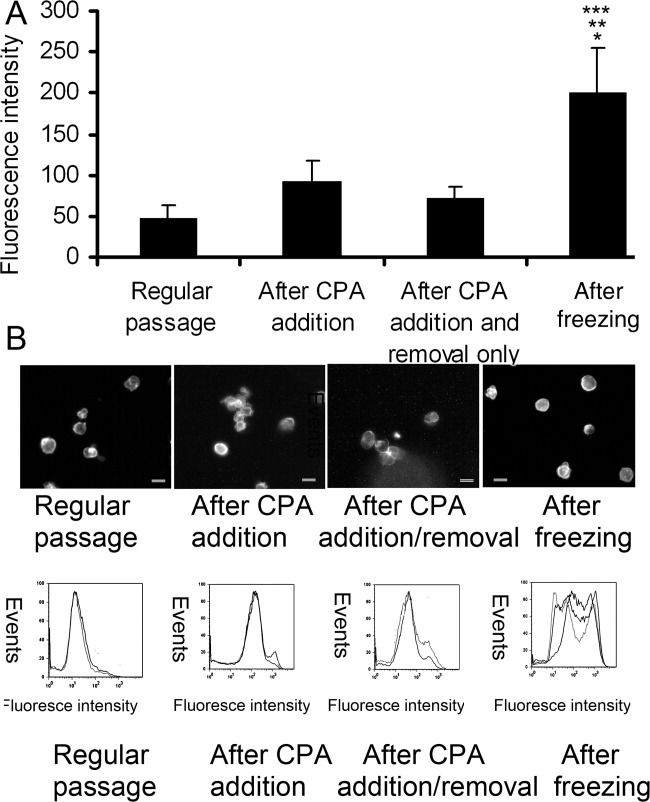
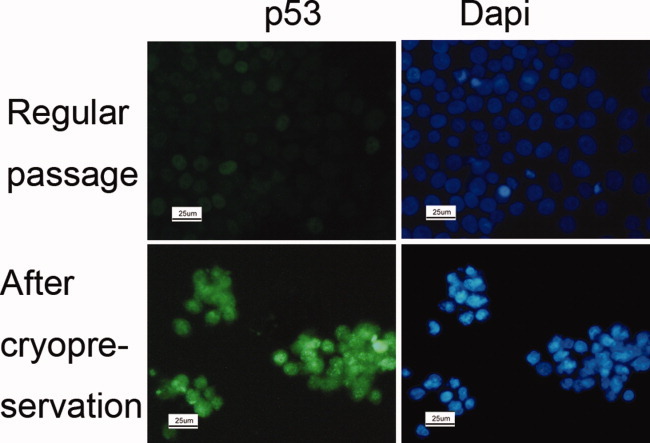
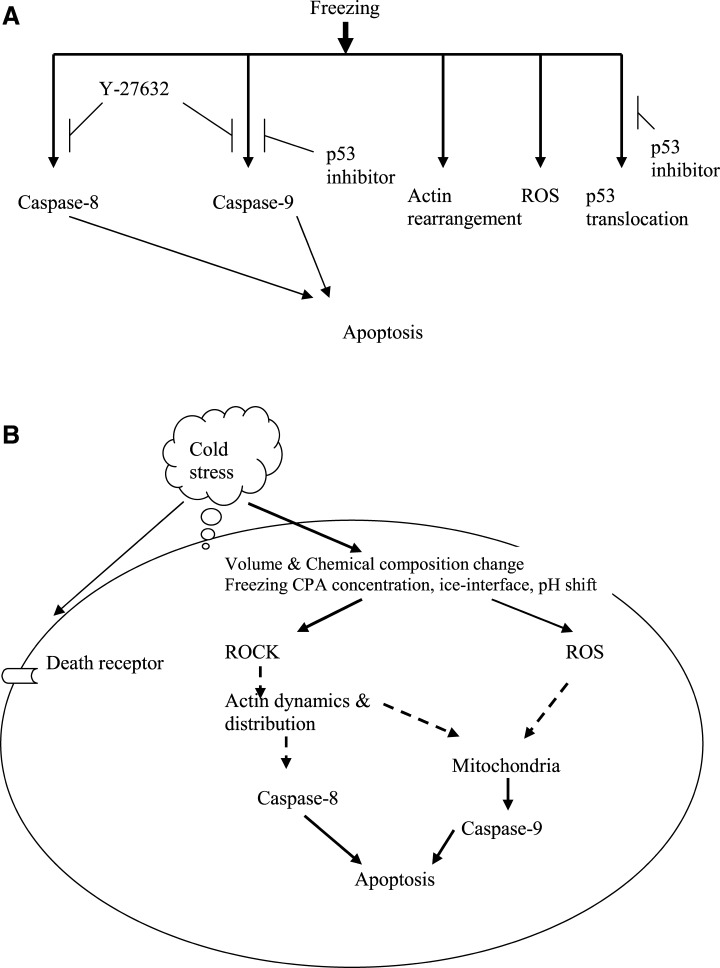
Human embryonic stem (hES) cells have enormous potential for clinical applications. However, one major challenge is to achieve high cell recovery rate after cryopreservation. Understanding how the conventional cryopreservation protocol fails to protect the cells is a prerequisite for developing efficient and successful cryopreservation methods for hES cell lines and banks. We investigated how the stimuli from cryopreservation result in apoptosis, which causes the low cell recovery rate after cryopreservation. The level of reactive oxygen species (ROS) is significantly increased, F-actin content and distribution is altered, and caspase-8 and caspase-9 are activated after cryopreservation. p53 is also activated and translocated into nucleus. During cryopreservation apoptosis is induced by activation of both caspase-8 through the extrinsic pathway and caspase-9 through the intrinsic pathway. However, exactly how the extrinsic pathway is activated is still unclear and deserves further investigation.
Copyright 2010 American Institute of Chemical Engineers
Figures
Similar articles
-
Enhancement of cell recovery for dissociated human embryonic stem cells after cryopreservation.Biotechnol Prog. 2010 May-Jun;26(3):781-8. doi: 10.1002/btpr.358. Biotechnol Prog. 2010. PMID: 20014103 Free PMC article.
-
Gene pathway analysis of the mechanism by which the Rho-associated kinase inhibitor Y-27632 inhibits apoptosis in isolated thawed human embryonic stem cells.Cryobiology. 2012 Feb;64(1):12-22. doi: 10.1016/j.cryobiol.2011.11.005. Epub 2011 Nov 23. Cryobiology. 2012. PMID: 22133891
-
Efficient recovery of undifferentiated human embryonic stem cell cryopreserved with hydroxyethyl starch, dimethyl sulphoxide and serum replacement.Cryobiology. 2015 Aug;71(1):151-60. doi: 10.1016/j.cryobiol.2015.01.005. Epub 2015 Jan 29. Cryobiology. 2015. PMID: 25641609
-
Slow Cooling Cryopreservation Optimized to Human Pluripotent Stem Cells.Adv Exp Med Biol. 2016;951:57-65. doi: 10.1007/978-3-319-45457-3_5. Adv Exp Med Biol. 2016. PMID: 27837554 Review.
-
Hydroxyethylstarch in cryopreservation - mechanisms, benefits and problems.Transfus Apher Sci. 2012 Apr;46(2):137-47. doi: 10.1016/j.transci.2012.01.007. Epub 2012 Feb 19. Transfus Apher Sci. 2012. PMID: 22349548 Review.
Cited by
-
"Universal" vitrification of cells by ultra-fast cooling.Technology (Singap World Sci). 2015 Mar;3(1):64-71. doi: 10.1142/S2339547815500053. Technology (Singap World Sci). 2015. PMID: 25914896 Free PMC article.
-
Human leukemia cells (HL-60) proteomic and biological signatures underpinning cryo-damage are differentially modulated by novel cryo-additives.Gigascience. 2019 Mar 1;8(3):giy155. doi: 10.1093/gigascience/giy155. Gigascience. 2019. PMID: 30535373 Free PMC article.
-
Unprecedented cell-selection using ultra-quick freezing combined with aquaporin expression.PLoS One. 2014 Feb 18;9(2):e87644. doi: 10.1371/journal.pone.0087644. eCollection 2014. PLoS One. 2014. PMID: 24558371 Free PMC article.
-
Functional human iPSC-derived alveolar-like cells cultured in a miniaturized 96‑Transwell air-liquid interface model.Sci Rep. 2021 Aug 23;11(1):17028. doi: 10.1038/s41598-021-96565-4. Sci Rep. 2021. PMID: 34426605 Free PMC article.
-
Comparison of primordial germ cell differences at different developmental time points in chickens.Anim Biosci. 2024 Nov;37(11):1873-1886. doi: 10.5713/ab.24.0283. Epub 2024 Aug 5. Anim Biosci. 2024. PMID: 39118547 Free PMC article.
References
-
- Gerecht-Nir S, Itskovitz-Eldor J. Human embryonic stem cells: a potential source for cellular therapy. Am J Transplant. 2004;4(Suppl 6):51–57. - PubMed
-
- Heng BC, Liu H, Toh WS, Rufaihah AJ, Yang Z, Bay BH, Ge Z, Quang HW, Lee EH, Cao T. Loss of viability during freeze-thaw of intact and adherent human embryonic stem cells with conventional slow-cooling protocols is predominantly due to apoptosis rather than cellular necrosis. J Biomed Sci. 2005;13:433–445. - PubMed
-
- Karlsson JOM, And Toner M. Cryopreservation. In: Lanza RP, Lang R, Vacanti J, editors. Pinciples of Tissue Engineering. San Diego: Academic Press; 2000. pp. 293–308.
-
- Salvesen GS. Caspase and apoptosis. Essays Biochem. 2002;38:9–19. - PubMed
-
- Nakano K, Vousden KH. PUMA, a novel proapoptotic gene, is induced by p53. Mol Cell. 2001;7:683–694. - PubMed
Publication types
MeSH terms
Substances
Grants and funding
LinkOut - more resources
Full Text Sources
Other Literature Sources
Research Materials
Miscellaneous
