

Automated analysis of lesion depth and integrated reflectivity in PS-OCT scans of tooth demineralization
- PMID: 20077486
- PMCID: PMC3192502
- DOI: 10.1002/lsm.20862
Automated analysis of lesion depth and integrated reflectivity in PS-OCT scans of tooth demineralization
Abstract
Background and objectives: Several studies have demonstrated that polarization sensitive optical coherence tomography (PS-OCT) can be used to nondestructively measure the severity of subsurface demineralization in enamel and dentin, track lesion progression over time and measure remineralization. The purpose of this study was to develop methods for the automated assessment of the depth and severity of demineralization in PS-OCT scans.
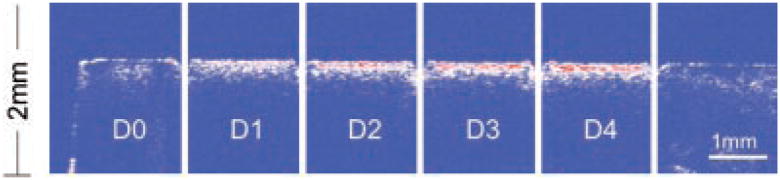
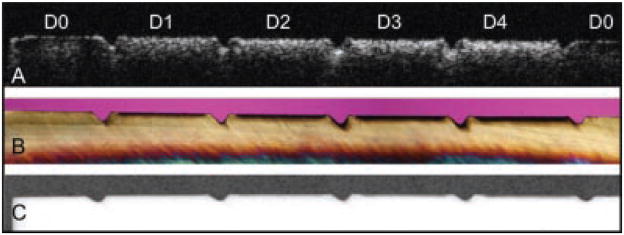
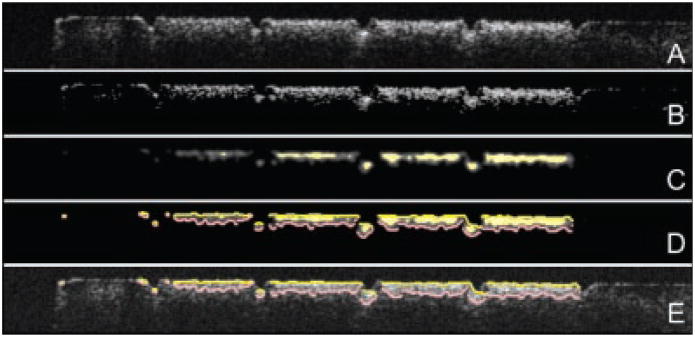
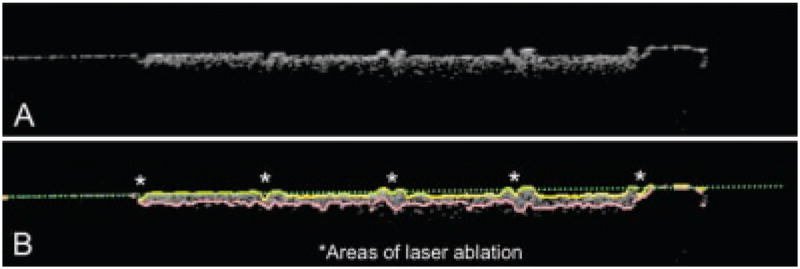
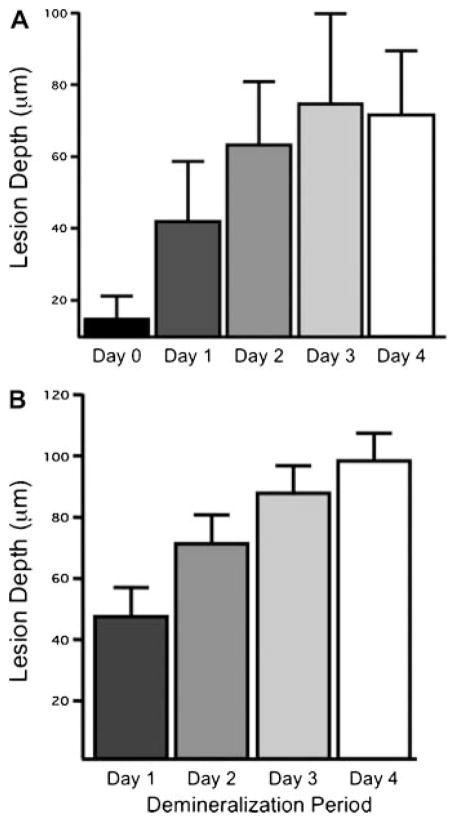
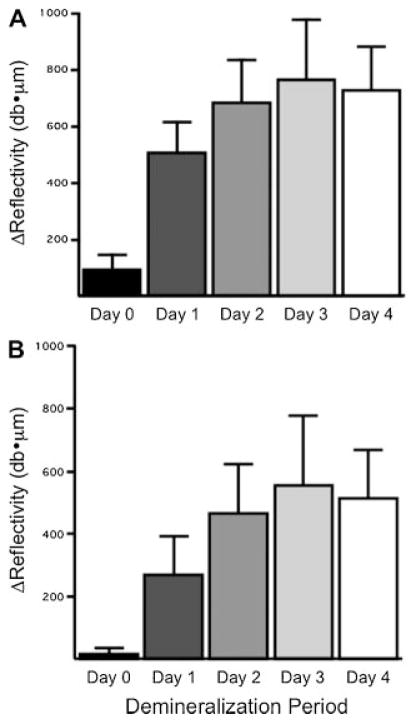
Materials and methods: Subsurface caries-like lesions of increasing depth and severity were produced in adjoining windows on 10 bovine enamel samples via exposure to demineralization for periods of 1-4 days. PS-OCT scans were acquired for each sample and analyzed using various methods to calculate the lesion depth and severity. Edge detection algorithms were most successful for measurement of the lesion depth for improved assessment of lesion severity.
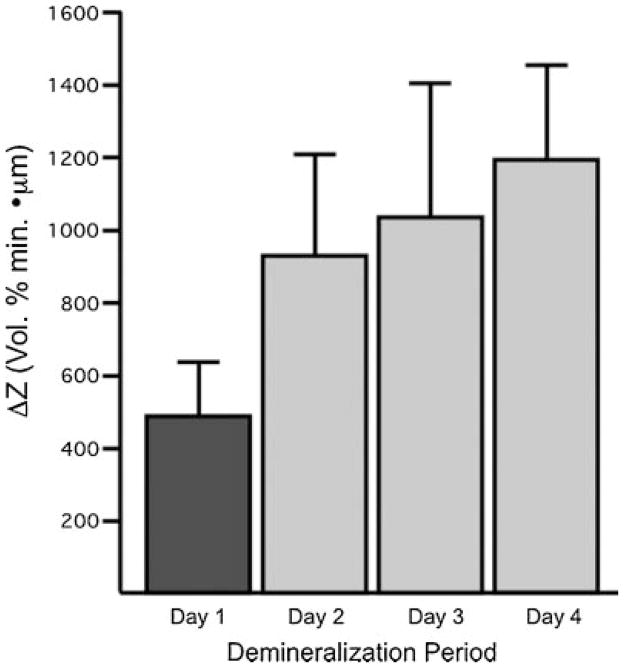
Results: Edge-finding algorithms were able to detect significant differences (P<0.05) in the lesion depth and severity between each of the periods of demineralization and sound enamel. The lesion depth and mineral loss were also measured with polarized light microscopy and transverse microradiography after sectioning the teeth for comparison.
Conclusions: This study demonstrates that the depth and severity of early lesions can be calculated automatically for rapid analysis of PS-OCT images.
Figures
References
-
- NIH. Diagnosis and Management of Dental Caries throughout Life: NIH Consensus Statement; 2001 March 26–28, 2001. Report #18. :1–24. - PubMed
-
- Amaechi BT, Higham SM, Podoleanu AG, Rodgers JA, Jackson DA. Use of optical coherence tomography for assessment of dental caries. J Oral Rehabil. 2001;28(12):1092–1093. - PubMed
-
- Amaechi BT, Podoleanu AG, Komarov G, Higham SM, Jackson DA. Quantification of root caries using optical coherence tomography and microradiography: A correlational study. Oral Health Prev Dent. 2004;2(4):377–382. - PubMed
-
- Amaechi BT, Podoleanu A, Higham SM, Jackson DA. Correlation of quantitative light-induced fluorescence and optical coherence tomography applied for detection and quantification of early dental caries. J Biomed Opt. 2003;8(4):642–647. - PubMed
-
- Fried D, Xie J, Shafi S, Featherstone JDB, Breunig T, Lee CQ. Early detection of dental caries and lesion progression with polarization sensitive optical coherence tomography. J Biomed Opt. 2002;7(4):618–627. - PubMed
Publication types
MeSH terms
Grants and funding
LinkOut - more resources
Full Text Sources
