

Respiratory sound energy and its distribution patterns following clinical improvement of congestive heart failure: a pilot study
- PMID: 20078862
- PMCID: PMC2821310
- DOI: 10.1186/1471-227X-10-1
Respiratory sound energy and its distribution patterns following clinical improvement of congestive heart failure: a pilot study
Abstract
Background: Although congestive heart failure (CHF) patients typically present with abnormal auscultatory findings on lung examination, respiratory sounds are not normally subjected to additional analysis. The aim of this pilot study was to examine respiratory sound patterns of CHF patients using acoustic-based imaging technology. Lung vibration energy was examined during acute exacerbation and after clinical improvement.
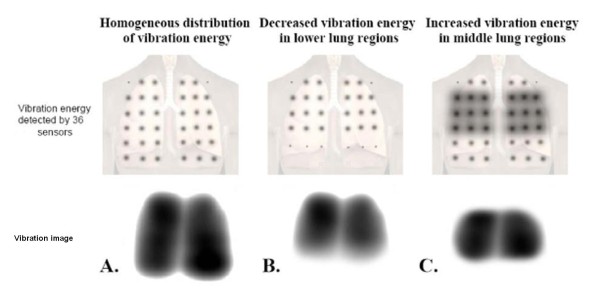
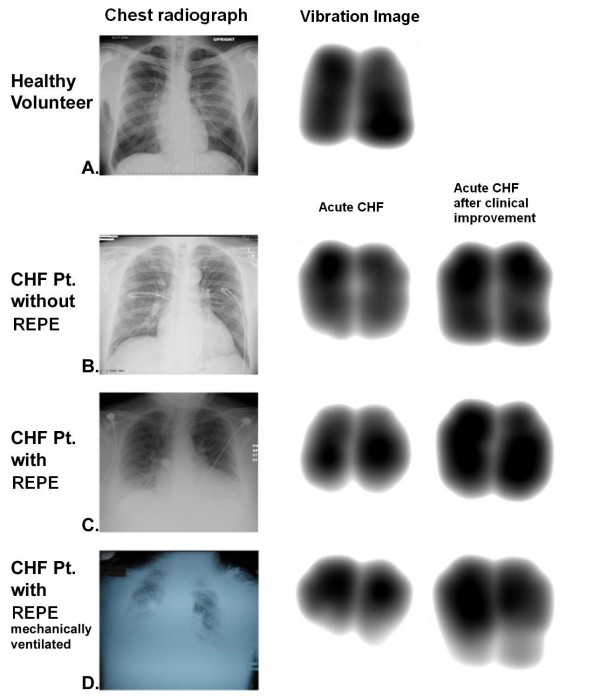
Methods: Respiratory sounds throughout the respiratory cycle were captured using an acoustic-based imaging technique. Twenty-three consecutive CHF patients were imaged at the time of presentation to the emergency department and after clinical improvement. Digital images were created (a larger image represents more homogeneously distributed vibration energy of respiratory sound). Geographical area of the images and respiratory sound patterns were quantitatively analyzed. Data from the CHF patients were also compared to healthy volunteers.
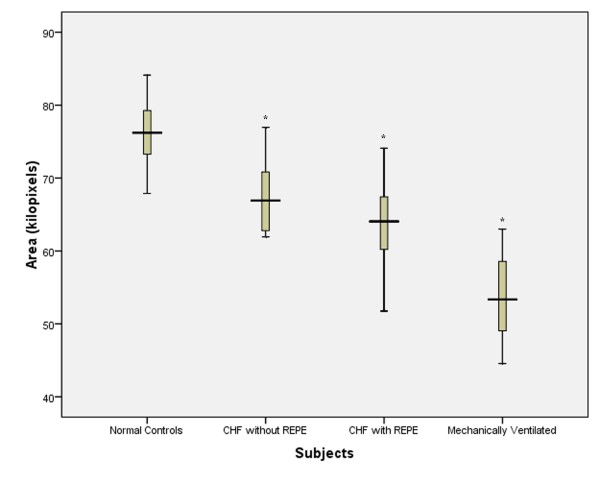
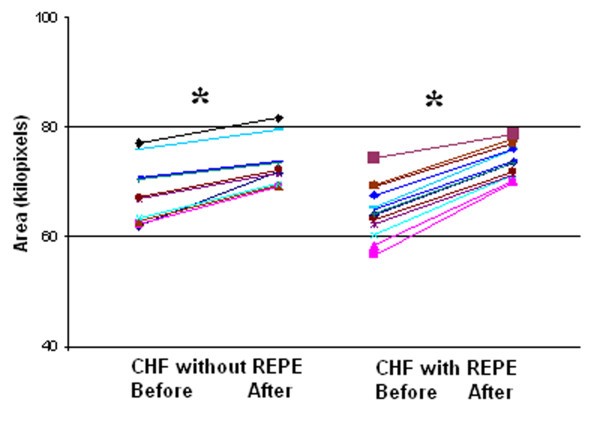
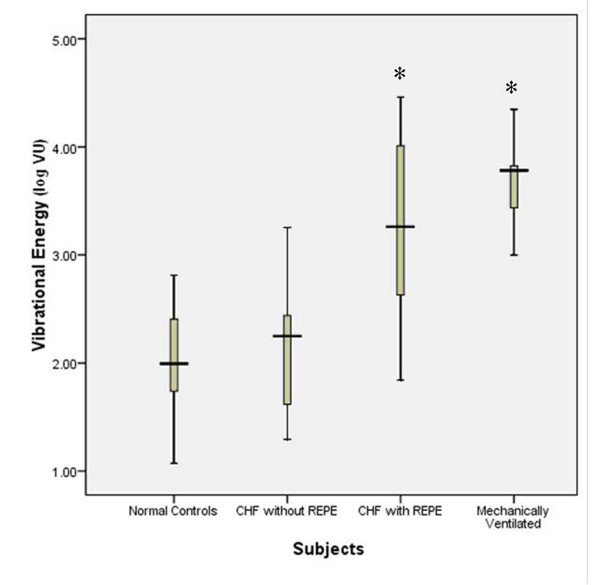
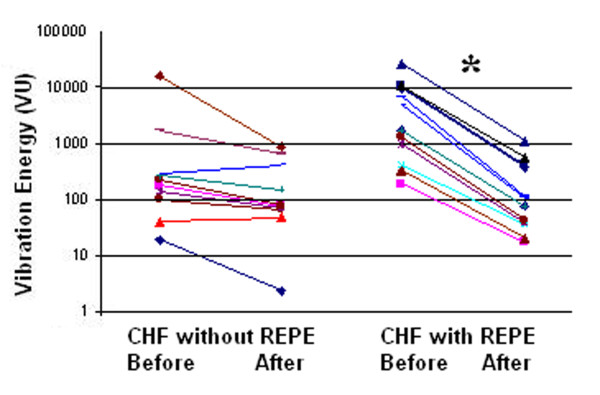
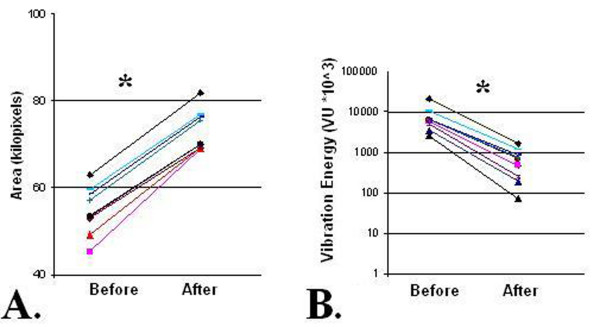
Results: The median (interquartile range) geographical areas of the vibration energy image of acute CHF patients without and with radiographically evident pulmonary edema were 66.9 (9.0) and 64.1(9.0) kilo-pixels, respectively (p < 0.05). After clinical improvement, the geographical area of the vibration energy image of CHF patients without and with radiographically evident pulmonary edema were increased by 18 +/- 15% (p < 0.05) and 25 +/- 16% (p < 0.05), respectively.
Conclusions: With clinical improvement of acute CHF exacerbations, there was more homogenous distribution of lung vibration energy, as demonstrated by the increased geographical area of the vibration energy image.
Figures
Similar articles
-
Computerized lung sound analysis following clinical improvement of pulmonary edema due to congestive heart failure exacerbations.Chin Med J (Engl). 2010 May 5;123(9):1127-32. Chin Med J (Engl). 2010. PMID: 20529550
-
Lung sound patterns help to distinguish congestive heart failure, chronic obstructive pulmonary disease, and asthma exacerbations.Acad Emerg Med. 2012 Jan;19(1):79-84. doi: 10.1111/j.1553-2712.2011.01255.x. Acad Emerg Med. 2012. PMID: 22251194
-
Vibration response imaging technology in healthy subjects.AJR Am J Roentgenol. 2008 Sep;191(3):845-52. doi: 10.2214/AJR.07.3151. AJR Am J Roentgenol. 2008. PMID: 18716118
-
Separating heart sounds from lung sounds. Accurate diagnosis of respiratory disease depends on understanding noises.IEEE Eng Med Biol Mag. 2007 Jan-Feb;26(1):20-9. doi: 10.1109/memb.2007.289118. IEEE Eng Med Biol Mag. 2007. PMID: 17278769 Review. No abstract available.
-
[Normal and Adventitious Breath Sounds].Pneumologie. 2016 Jun;70(6):397-404. doi: 10.1055/s-0042-106155. Epub 2016 May 13. Pneumologie. 2016. PMID: 27177168 Review. German.
Cited by
-
New Functional Imaging Technology to Differentiate between Chronic Obstructive Pulmonary Disease and Heart Failure.West J Emerg Med. 2011 Feb;12(1):17-8. West J Emerg Med. 2011. PMID: 21691467 Free PMC article. No abstract available.
-
[Stereotypical episodes of vomiting for 11 years in a 33-year-old patient].Internist (Berl). 2012 Mar;53(3):345-50. doi: 10.1007/s00108-011-2962-9. Internist (Berl). 2012. PMID: 22146936 German.
References
-
- Congestive Heart Failure and Pulmonary Edema. http://www.emedicine.com/EMERG/topic108.htm
-
- Braunwald E, Zipes DP, Libby P. Heart disease: a textbook of cardiovascular medicine. Philadelphia. 6 2000.
-
- Pasterkamp H, Kraman SS, Wodicka GR. Respiratory Sounds-Advances Beyond the Stethoscope. Am J Respir Crit Care Med. 1997;156:974–987. - PubMed
MeSH terms
LinkOut - more resources
Full Text Sources
Medical
