. 2010 Jan 8;140(1):49-61.
doi: 10.1016/j.cell.2009.11.027.

Monoacylglycerol lipase regulates a fatty acid network that promotes cancer pathogenesis

Affiliations

Monoacylglycerol lipase regulates a fatty acid network that promotes cancer pathogenesis

Daniel K Nomura et al. Cell. .

Abstract

Tumor cells display progressive changes in metabolism that correlate with malignancy, including development of a lipogenic phenotype. How stored fats are liberated and remodeled to support cancer pathogenesis, however, remains unknown. Here, we show that the enzyme monoacylglycerol lipase (MAGL) is highly expressed in aggressive human cancer cells and primary tumors, where it regulates a fatty acid network enriched in oncogenic signaling lipids that promotes migration, invasion, survival, and in vivo tumor growth. Overexpression of MAGL in nonaggressive cancer cells recapitulates this fatty acid network and increases their pathogenicity-phenotypes that are reversed by an MAGL inhibitor. Impairments in MAGL-dependent tumor growth are rescued by a high-fat diet, indicating that exogenous sources of fatty acids can contribute to malignancy in cancers lacking MAGL activity. Together, these findings reveal how cancer cells can co-opt a lipolytic enzyme to translate their lipogenic state into an array of protumorigenic signals. PAPERFLICK:


Figures

Figure 1
Figure 1
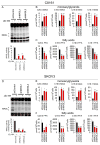
MAGL is elevated in aggressive cancer cells, where the enzyme regulates monoacylgycerol (MAG) and free fatty acid (FFA) levels. (A) ABPP of serine hydrolase activities in non-aggressive (blue) and aggressive (red) human cancer cell lines. Serine hydrolase activities were labeled in whole cell proteomes with the activity-based probe FP-rhodamine and detected by SDS-PAGE and in-gel fluorescence scanning (fluorescent gel shown in grayscale). Highlighted in red boxes are two enzymes, MAGL and KIAA1363 that are consistently elevated in aggressive versus nonaggressive cancer cells. Proteomes were also prepared from cancer cells pretreated with DMSO or the selective MAGL inhibitor JZL184 (1 μM, 4 h) to confirm that the 33 and 35 kDa FP-rhodamine-labeled bands represented MAGL. See Figure S1 for quantification of FP-rhodamine labeling signals for MAGL and KIAA1363 across the panel of cancer lines and Tables S1-3 for a global analysis of FP-biotin-labeled serine hydrolase activities detected by ABPP in cancer cells. (B) C20:4 MAG hydrolytic activity of cancer cells in the presence (red bars) or absence (black bars) of JZL184 (1 μM, 4 hr). (C, D) Inhibition of MAGL (JZL184 1 μM, 4h) raises MAG (C) and lowers FFA (D) levels in aggressive, but not nonaggressive cells. Note that aggressive cancer cells possess basally higher levels of FFAs (and lower levels of MAGs) compared to non-aggressive cancer cells, reflecting their respective MAGL activities. * p < 0.05, ** p < 0.01 for JZL184-treated versus DMSO-treated control groups. # p < 0.05, ## p < 0.01 for aggressive versus non-aggressive cancer cells. Data are presented as means ± SEM; n = 4–5/group.
Figure 2
Figure 2
Stable shRNA-mediated knockdown of MAGL lowers FFA levels in aggressive cancer cells. (A, D) MAGL was stably knocked down using two independent short hairpin RNA (shRNA) oligonucleotides (shMAGL1, shMAGL2), resulting in > 70% reductions in MAGL activity in C8161 and SKOV3 cells compared to shControl cells expressing an shRNA that targets a distinct serine hydrolase (DPPIV). (B, C, E, F) shMAGL cells show elevations in MAG (B, E) and reductions in FFA (C, F) levels. * p < 0.05, ** p < 0.01 for shMAGL- versus shControl groups. # p < 0.05, ## p < 0.01 for aggressive versus non-aggressive cancer cells. The MAGL activity and MAG and FFA levels of shControl cells did not differ significantly from those of parental cancer lines (shown in Figure 1). Data are presented as means ± SEM; n = 4–5/group.
Figure 3
Figure 3
High-grade primary human ovarian tumors possess elevated MAGL activity and FFAs compared to benign tumors. (A) C20:4 MAG hydrolytic activity measurements for individual tumor specimens. Pre-treatment with JZL184 (1 μM, 30 min) confirmed that the majority of the observed hydrolytic activity is due to MAGL. (B) Summary graph of MAGL activity in benign versus high-grade tumors, where each value is expressed as the JZL184-sensitive portion of total C20:4 MAG hydrolytic activity shown in part (A). (C) Levels of FFAs in benign versus high-grade tumors. ** p < 0.01 for high-grade versus benign tumor groups. Data are presented as means ± SEM; n = 10–13/group.
Figure 4
Figure 4
shRNA-mediated knockdown and pharmacological inhibition of MAGL impair cancer aggressiveness. (A–C, F–G) shMAGL cells show decreased migration (A, F), invasion (B, G), and cell survival (C,H) compared to shControl and uninfected parental cells. Migration and invasion assays were performed by transferring cancer cells to serum-free media for 4 hours prior to seeding 50,000 cells into inserts with 8 μm-pore size containing membranes coated with collagen (10μg/ml) or BioCoatTM Matrigel™, respectively. C8161 and SKOV3 migration times were 5 h and 20 h, respectively. Migrated or invaded cells refer to average numbers ± sem per four fields counted at 400× magnification.. Cell survival assays were performed by seeding 20,000 cells into 96 well plates in serum-free media. Survival was assessed using the WST-1 proliferation assay. Representative migration plates (at 400 x magnification) are shown for shControl versus shMAGL cells (A, F). (D, I) shMAGL cells show impaired tumor growth in SCID mice compared to shControl and uninfected parental cells. 2 × 10⁶ C8161 or SKOV3 cells/100 μl were injected subcutaneously into the flank and tumor growth was measured using calipers. (E, J) JZL184 treatment (40 mg/kg daily oral administration in 4 μl/g polyethylene glycerol 300 vehicle) significantly decreases tumor xenograft growth rates in SCID mice compared to vehicle treatment. * p < 0.05, ** p < 0.01 for shMAGL- versus shControl or JZL184- versus vehicle-treatment groups. shControl and parental cancer cells did not differ significantly in their migration, cell survival, invasion, or in vivo tumor growth. Data are presented as means ± SEM; n = 5–8/group.
FIgure 5
FIgure 5
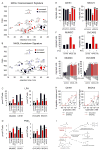
Ectopic expression of MAGL elevates FFA levels and enhances the in vitro and in vivo pathogenicity of MUM2C melanoma cells. (A) MAGL overexpression (MAGL-OE, red bars) in MUM2C cells confirmed by ABPP (top panel), western blot (middle panel) and C20:4 MAG hydrolytic activity (bottom panel). Control and S122A cells (black bars) correspond to cancer cells infected with empty vector (EV) or a catalytically inactive MAGL mutant (S122A), respectively. Western analysis confirmed the overexpression of the S122A-MAGL mutant, which did not show any activity as judged by ABPP and C20:4 MAG hydrolysis assays. (B, C) MAGL-OE cells contain lower MAG (B) and higher FFA (C) levels compared to EV control and S122A cells. These metabolic effects were reversed by in situ treatment with JZL184 (1 μM, 4 h, maroon bars). (D, E) MAGL-OE MUM2C cells show increased migration (D) and invasion (E) compared to EV and S122A control cells. This enhanced migration and invasion was reversed by JZL184 (1 μM, 4 h). Representative migration panels are shown (D). (F) MAGL-OE MUM2C cells show a significantly enhanced tumor growth rate compared to EV or S122A control cells in SCID mice (orthotopically implanted with 2 × 10⁶ cells). * p < 0.05, ** p < 0.01 for MAGL-OE- versus control groups. Data are presented as means ± SEM; n = 4–6/group.
Figure 6
Figure 6
Recovery of the pathogenic properties of shMAGL cancer cells by treatment with exogenous fatty acids. (A) The reduced migration of shMAGL cells is reversed by treatment with palmitic or stearic acid (20 μM, 4 h, hatched red bars). (B) Addition of palmitic or stearic acid (20 μM, 4 h) increases the migration of MUM2C and OVCAR3 cells and rescues the reduced migration in JZL184-treated MAGL-OE cells. (C) The reduced tumor growth of shMAGL-C8161 cells is reversed by treatment with a high-fat diet (HFD) (60 kcal % fat). Mice were placed on normal chow (NC) or HFD two weeks prior to flank injection of cancer cells and maintained on these diets throughout the tumor growth time course. Inset, body weights for animals throughout time course. (D) Explanted shMAGL tumors from the HFD-group (hatched red bars) contain elevated FFA levels compared to shMAGL tumors from the NC-group (red bars). * p < 0.05, ** p < 0.01 shMAGL versus shControl groups. ## p < 0.01 for palmitic or stearic acid- or HFD-treated shMAGL groups versus shMAGL control groups (DMSO- and NC-treated groups, respectively). Data are presented as means ± SEM; For (A), n = 4–5/group; for (B, C), n = 7–8/group.
Figure 7
Figure 7
MAGL regulates a lipid network enriched in pro-tumorigenic signaling molecules. (A, B) Lipidomic analyses of cancer cell models with altered MAGL activity comparing MAGL-OE versus EV control (A) and shMAGL versus shControl (B) cells. The metabolites shown are those that were increased (red) or decreased (blue) in MAGL-OE (both MUM2C and OVCAR3) versus EV control cells (A) and showed the opposite profile in shMAGL (both C8161 and SKOV3) versus shControl cells (B). Parent masses of metabolites are provided, and the size of circles indicates the relative magnitude of change. Quantitation of lipid levels are provided in Table S4. (C, D) Quantitation of C16:0 LPA and PGE2 levels in cancer cell models. (E) Treatment of shMAGL cancer cells with C16:0 LPA (100 nM, 4 h) or PGE2 (100 nM, 4 h) rescues their defective migration compared to shControl cells. (F) Pertussis toxin (PTX) (100 ng/ml, 4 h) reverses the increased migration of MAGL-OE cancer cells. (G) Concentration-dependent stimulation of migration by LPA in EV control versus MAGL-OE cells. Note that the maximal stimulation of migration induced by LPA In EV control cells matches the basally enhanced migration observe din MAGL-OE cells, and LPA does not further increase the migration of MAGL-OE cells. (H). Sensitivity of shControl versus shMAGL cancer cells to the EGFR inhibitor tyrphostin AG-1478, expressed as percentage of migration impairment. The absolute numbers of migrated cells and the effect of tyrphostin on cell survival are shown in Figure S6. IC50 values for the anti-migratory effects of tyrphostin are provided in the panels. (I) Scheme showing a possible metabolic network connecting the MAGL-FFA pathway to other pro-tumorigenic lipids. For (A) and (B), data are presented as mean relative changes between comparison groups; n = 4–5/group. For (C–G), * p < 0.05, ** p < 0.01 for MAGL-OE or shMAGL versus respective control cell groups (C–G), JZL184-treated versus DMSO-treated control cells (C, D). ##, p < 0.01 for parental non-aggressive (MUM2C, OVCAR3) versus aggressive (C8161, SKOV3) cells (C, D), or LPA/PGE2-treated shMAGL versus shControl cells (E). Data are presented as means ± SEM; n = 3–5/group.

Comment in

References

    1. Ahn K, McKinney MK, Cravatt BF. Enzymatic pathways that regulate endocannabinoid signaling in the nervous system. Chem Rev. 2008;108:1687–1707. - PMC - PubMed
    1. Bektas M, Payne SG, Liu H, Goparaju S, Milstien S, Spiegel S. A novel acylglycerol kinase that produces lysophosphatidic acid modulates cross talk with EGFR in prostate cancer cells. J Cell Biol. 2005;169:801–811. - PMC - PubMed
    1. Blankman JL, Simon GM, Cravatt BF. A comprehensive profile of brain enzymes that hydrolyze the endocannabinoid 2-arachidonoylglycerol. Chem Biol. 2007;14:1347–1356. - PMC - PubMed
    1. Buzzai M, Bauer DE, Jones RG, Deberardinis RJ, Hatzivassiliou G, Elstrom RL, Thompson CB. The glucose dependence of Akt-transformed cells can be reversed by pharmacologic activation of fatty acid beta-oxidation. Oncogene. 2005;24:4165–4173. - PubMed
    1. Buzzai M, Jones RG, Amaravadi RK, Lum JJ, DeBerardinis RJ, Zhao F, Viollet B, Thompson CB. Systemic treatment with the antidiabetic drug metformin selectively impairs p53-deficient tumor cell growth. Cancer Res. 2007;67:6745–6752. - PubMed

Publication types