. 2010 Mar 30;187(2):171-82.
doi: 10.1016/j.jneumeth.2010.01.009. Epub 2010 Jan 14.

Intrinsic signal optical imaging of brain function using short stimulus delivery intervals

Affiliations

Intrinsic signal optical imaging of brain function using short stimulus delivery intervals

Cynthia H Chen-Bee et al. J Neurosci Methods. .

Abstract

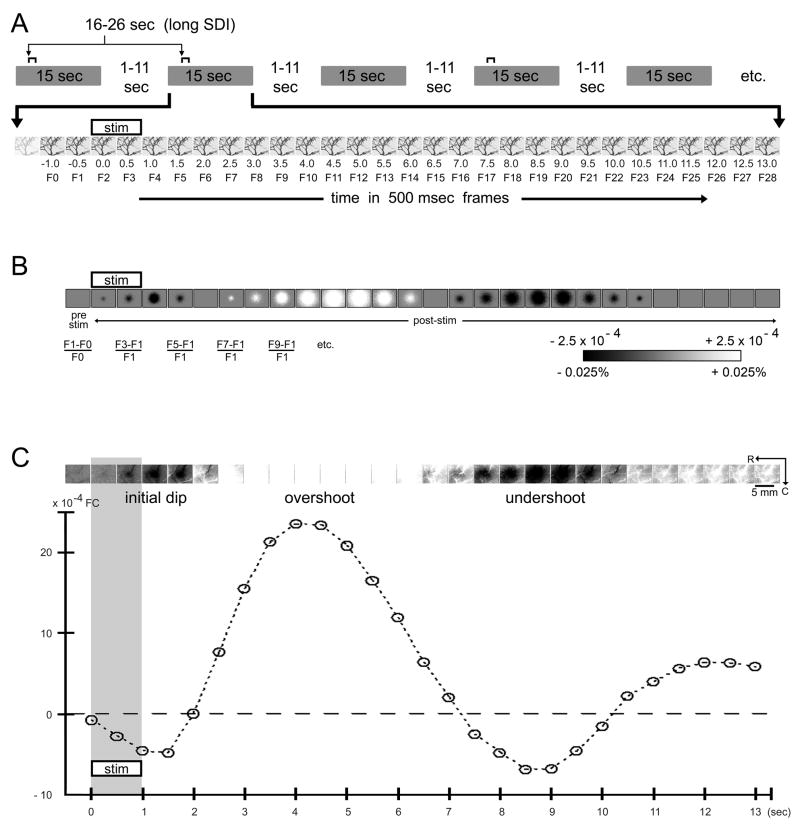
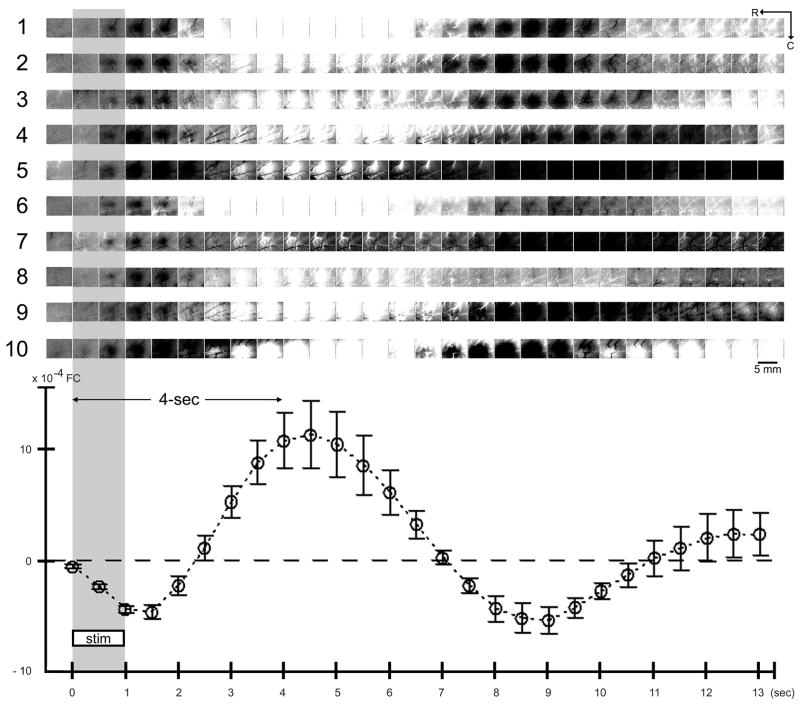
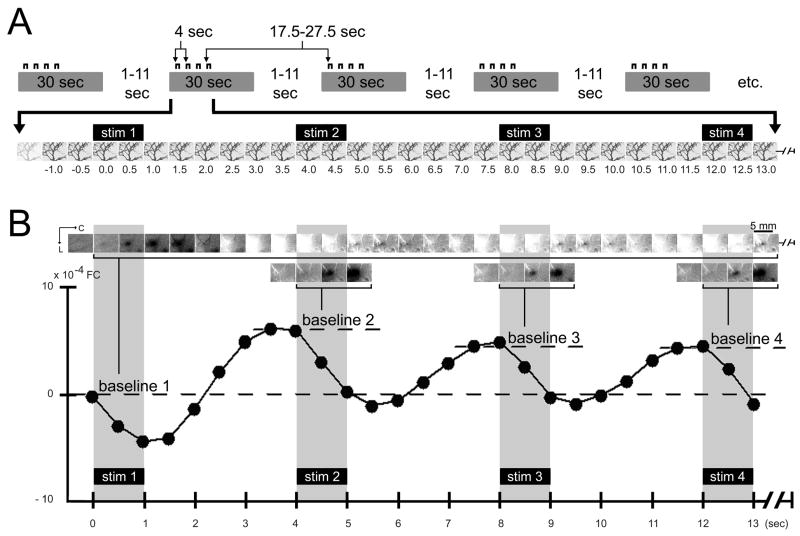
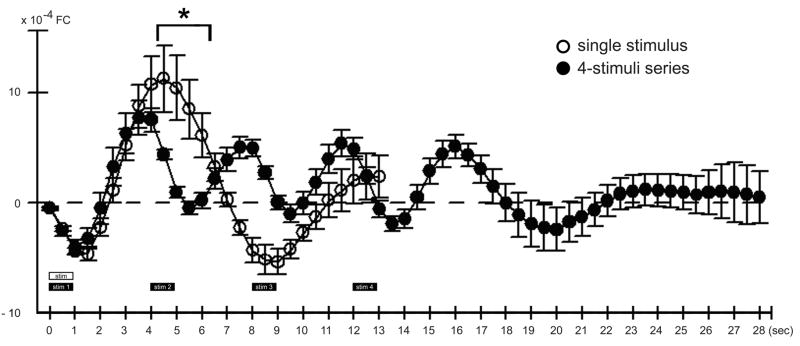
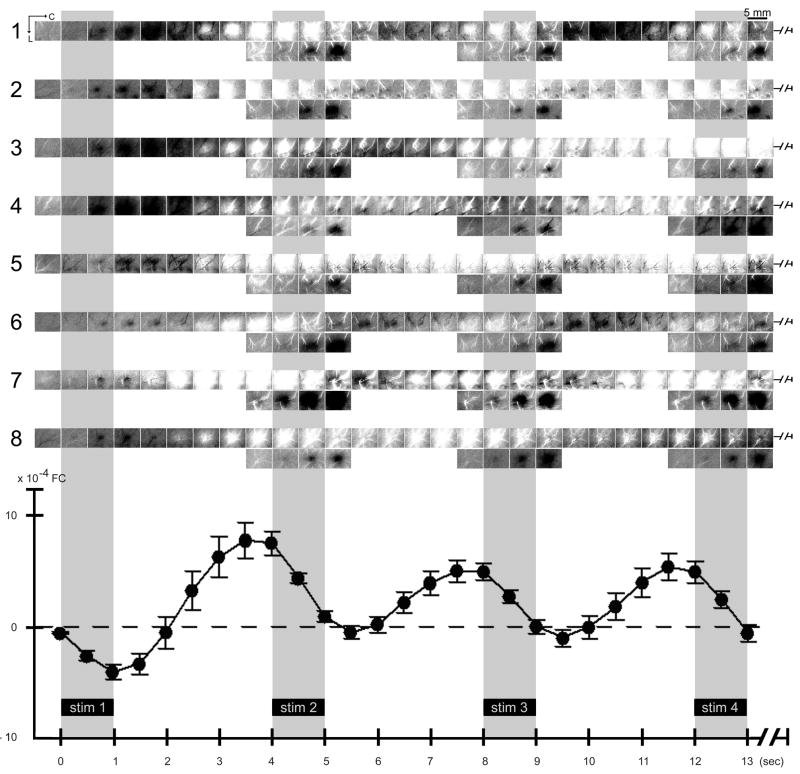
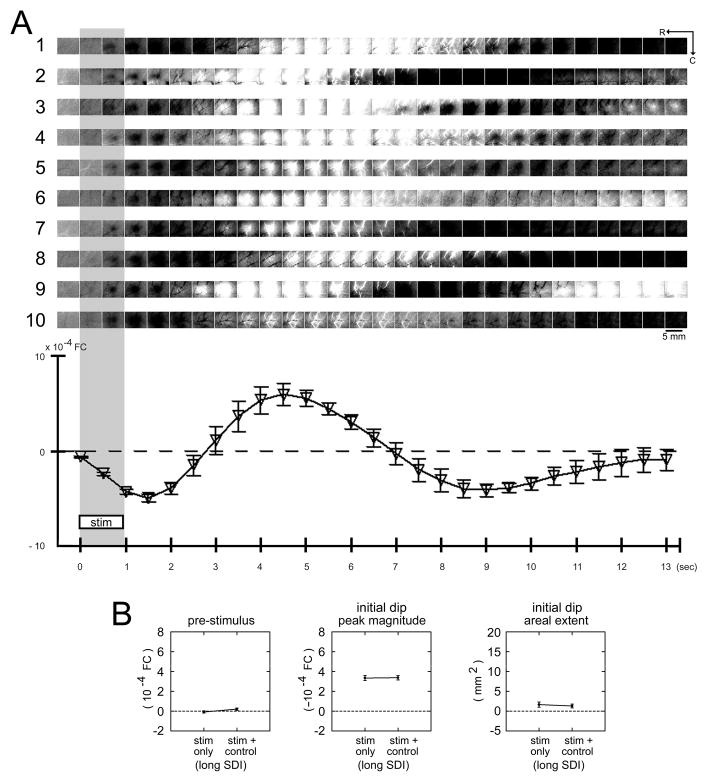
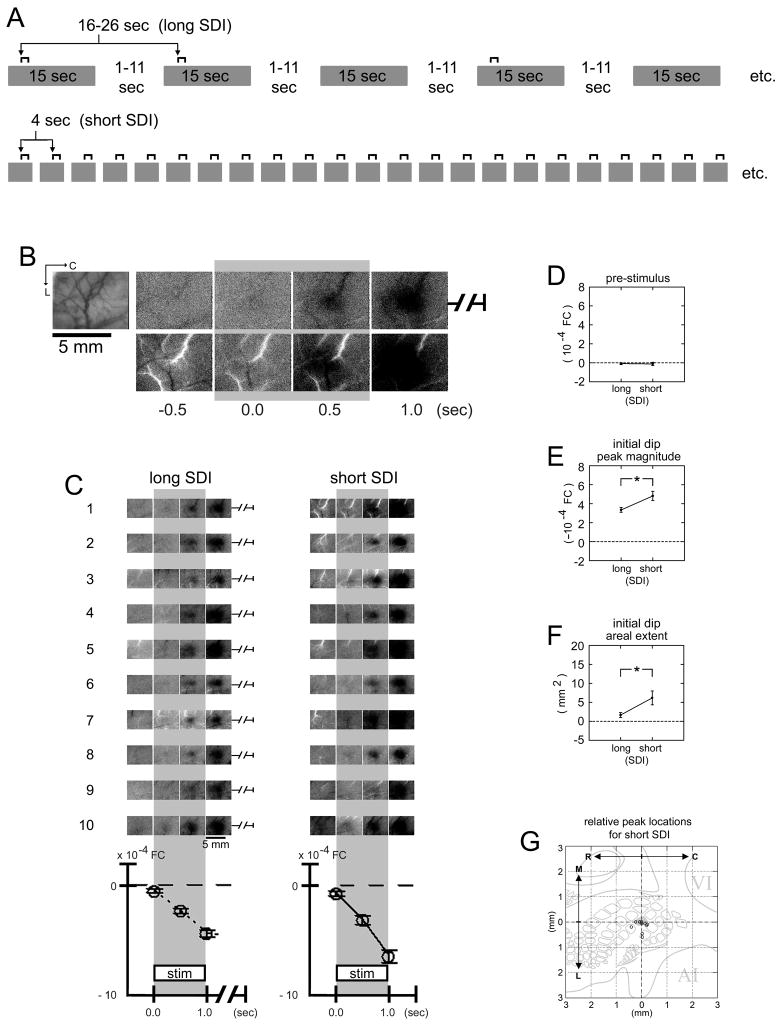
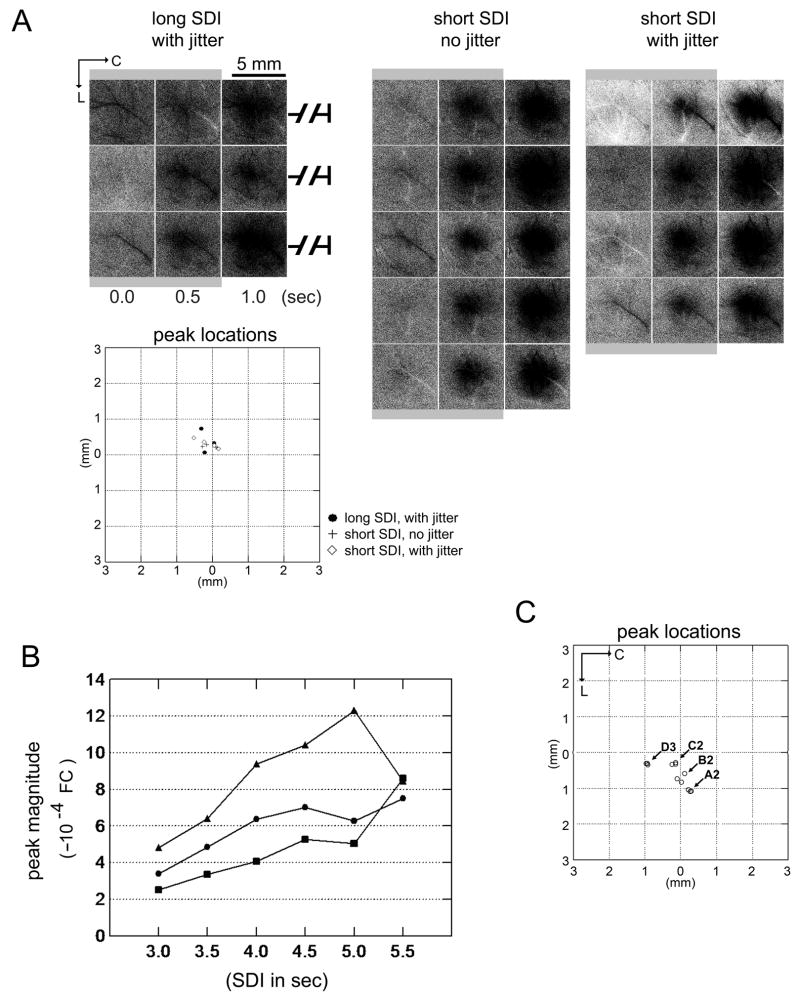
Intrinsic signal optical imaging (ISOI) can be used to map cortical function and organization. Because its detected signal lasts 10+s consisting of three phases, trials are typically collected using a long (tens of seconds) stimulus delivery interval (SDI) at the expense of efficiency, even when interested in mapping only the first signal phase (e.g., ISOI initial dip). It is unclear how the activity profile can change when stimuli are delivered at shorter intervals, and whether a short SDI can be implemented to improve efficiency. The goals of the present study are twofold: characterize the ISOI activity profile when multiple stimuli are delivered at 4s intervals, and determine whether successful mapping can be attained from trials collected using an SDI of 4s (offering >10x increase in efficiency). Our results indicate that four stimuli delivered 4s apart evoke an activity profile different from the triphasic signal, consisting of signal dips in a series at the same frequency as the stimuli despite a strong rise in signal prior to the 2nd to 4th stimuli. Visualization of such signal dips is dependent on using a baseline immediately prior to every stimulus. Use of the 4-s SDI is confirmed to successfully map activity with a similar location in peak activity and increased areal extent and peak magnitude compared to using a long SDI. Additional experiments were performed to begin addressing issues such as SDI temporal jittering, response magnitude as a function of SDI duration, and application for successful mapping of cortical function topography.


Figures

Fig. 1
Fig. 1
Single stimulus delivery and trial collection using a long SDI (stim+control trials). (A) Schematic of trial accumulation. Trial collection parameters are detailed in Table 1, Column 1. Because an equal number of control trials were collected, stimulus delivery intervals (SDIs) were in essence centered at 42 sec with a jitter range of 20+ sec. One stimulation trial is enlarged to illustrate the temporal relationship between stimulus delivery and the 500-msec frames (dark streaks depict large dural and cortical surface blood vessels). (B) Schematic of visualizing intrinsic signal activity. Post-stimulus frames are converted to fractional change (FC) values relative to pre-stimulus data. For details see Materials and Methods; grayscale bar applies to all applicable figures. (C) Visualization and plot of intrinsic signal activity for a representative rat. A single stimulus delivery using a long SDI evoked a triphasic signal. Activity was relatively stable prior to stimulus onset, evidenced by a homogeneous pre-stimulus image with only subtle contributions from blood vessels (light or dark streaks). The post-stimulus intrinsic signal time course from the location of peak initial dip activity was extracted and plotted.
Fig. 2
Fig. 2
Single stimulus delivery and trial collection using a long SDI (stim+control trials) - summary of 10 rats. Visualization and average plot (means and standard errors) of the triphasic intrinsic signal are provided for ten rats. First rat is the same as in Fig. 1C. Note that on average the overshoot signal peaked approximately 4 sec after stimulus onset.
Fig. 3
Fig. 3
Activity profile for multiple stimuli delivered at 4 sec intervals. (A) Schematic of trial accumulation. Trial collection parameters are detailed in Table 1, Column 4. (B) Results for a representative rat. Plot. The post-stimulus intrinsic signal time course was extracted and plotted at the location of peak initial dip evoked by stim 1 delivery. Note that stim 1 of the 4-stimuli series evoked an initial dip plus onset of overshoot as typically observed for a single stimulus (compare to Figs. 1C plot and 2 plot). Upon delivery of stim 2–4, the signal was observed to reliably dip for each of stim 2–4 despite a strong rise in signal immediately prior to stimulus onset. Images. The same post-stimulus frames are visualized in reference to either the frame collected immediately prior to stim 1 (baseline 1; top row images) or the frame collected immediately prior to a particular stimulus delivery (stim 2, 3, or 4; baseline 2, 3, or 4, respectively; bottom row images). Note that an evoked dip in signal coinciding with a strong signal rise (as is the case for stim 2–4) can be effectively visualized as a dark activity area only when the frame immediately prior to each of stim 2–4 deliveries is used as baseline (bottom row images).
Fig. 4
Fig. 4
Activity profile evoked by a single stimulus using a long SDI versus the 4-stimuli series. Plotted here is the average signal time course (means and standard error bars) for a single stimulus delivery using a long SDI (open circle; same plot as in Fig. 2) versus the 4-stimuli series (filled circle). For the collective time points of 0 up until the 4 sec time point (stim 2 onset), no significant difference in signal time course was found between the two types of stimulus deliveries (F(1,15)=0.21, p=0.656), indicating that stim 1 of the 4-stimuli series evoked an initial dip and beginning portion of the overshoot comparable to that for a single stimulus using a long SDI. In contrast, a significant difference was found for the collective time points starting at 4.5 sec up through 6.0 sec (F(1,15)=9.83, p=0.007; asterisk), where compared to the overshoot evoked by a single stimulus using a long SDI (open circle) stim 2 delivery induced a dip in signal (filled circle). Note that stim 3–4 deliveries also each induced a dip in signal (filled circle).
Fig. 5
Fig. 5
Activity profile for multiple stimuli delivered at 4 sec intervals - summary of 10 rats. Average plot (means and standard errors) and visualization of the activity profile evoked by the 4-stimuli series are provided for 10 rats. First rat is the same as in Fig. 3B. For details see Fig. 3 legend.
Fig. 6
Fig. 6
Single stimulus delivery and trial collection using a long SDI – stim+control versus stim only. Trial collection parameters are detailed in Table 1, Columns 1 and 3. A between-subjects comparison was performed between the two types of long SDI (stim+control, see Fig. 2, versus stim only, see panel A in present figure). Two-tailed unpaired t-tests were performed on the pre-stimulus median, transformed areal extent, and transformed peak magnitude values. Also, a repeated measures ANOVA with one within-subjects variable (time point) and one between-subjects variable (type of long SDI) was performed on the FC values of the signal time course extracted at the location of peak ISOI initial dip activity. Prior to the ANOVA, one rat (case 10 for stim+control group) was excluded from statistical analysis (images and average plots for all 10 cases are provided in Fig. 2). (A) As with stim+control trials (see Fig. 2), a triphasic signal can still be obtained when only stimulation trials are collected – i.e., SDI is reduced by half, thereby achieving 2x increase in efficiency, but is still sufficiently long to avoid any overlap between consecutively evoked signals; also, pre-stimulus activity remained relatively homogeneous. In particular, note the similarity in the visualization and plotting of the initial dip compared to that in which stim+control trials were collected (compare to Fig. 2). No significant difference in the average signal time course was found between stim+control versus stim only when collapsing across all trial time points (repeated measures ANOVA, F(1,17)=3.73, p=0.07), nor was a significant interaction with trial time point obtained (repeated measures ANOVA, F(26,442)=0.77, p=0.79). (B–D) Means and standard errors are plotted to illustrate that no significant difference was found between stim+control versus stim only for the average pre-stimulus FC value (B; two-tailed two-sample t(18) = 1.88, p = 0.077), nor the peak magnitude (C; two-tailed two-sample t(18) = 0.13, p = 0.898) or areal extent (D; two-tailed two-sample t(18) = −0.27, p = 0.788) of the initial dip.
Fig. 7
Fig. 7
Activity maps from trial collection using a long versus short SDI within the same rat. (A) Schematic of trial collection. For each rat, trials using a long versus short SDI were collected as described in Table 1, Columns 1 and 3, respectively. (B) Results from a representative case (same as in Fig. 1C). Picture of the surface vasculature as seen through the thinned skull is provided for the imaged region. Images of pre- and post-stimulus activity are shown for the long (top row) versus short (bottom row) SDI. Stimulus delivery is indicated with a gray background bar. For the short SDI, the pre-stimulus image (−0.5 sec) appeared quite similar to that for the long SDI except for some ‘white’ vessel presence. Also, areal extent and signal strength of the evoked initial dip appeared stronger, along with some ‘white’ vessel presence. (C) Summary of results for 10 rats. First case provided is the same as in (B). Plots of average intrinsic signal (means and standard errors) for the first three post-stimulus time points are provided. Note the greater initial dip signal for the short SDI (right column) compared to the long SDI (left column). (D–F) Means and standard errors of pre-stimulus FC value and initial dip peak magnitude and areal extent. No significant difference (two-tailed paired t(9) = −0.20, p = 0.847) in pre-stimulus FC value was found between the two types of SDIs (long versus short; D). In contrast, a significant increase in the initial dip peak magnitude (two-tailed paired t(9) = 3.50, p = 0.007; E) and areal extent (two-tailed paired t(9) = 3.23, p = 0.010; F) was found for the short SDI. Asterisks denote p < 0.05. (G) Initial dip peak location. Initial dip peak locations for the short SDI are plotted relative to those for the long SDI (relative coordinate of 0,0 = perfect co-localization) and superimposed on an appropriately scaled schematic of cortical layer IV anatomical topography that includes portions of primary somatosensory (barrel of stimulated whisker is shaded in gray), visual (VI), and auditory (AI) cortices, with the relative origin centered above the barrel of the stimulated whisker. The peak locations were observed to co-register (within 0.2 mm away; i.e., within the stimulated whisker barrel) for half of the cases, with the remaining cases observed to be 0.2–0.5 mm away (i.e., within surrounding septa or adjacent whisker barrels).
Fig. 8
Fig. 8
Activity maps using a short SDI: temporal jittering, response magnitude versus SDI, and topographical mapping. (A) Temporal jittering of the 4-sec SDI. Within the same rat, multiple trial blocks were collected for each of three SDIs: long SDI with jitter (Table 1, Column 3); short SDI no jitter (Table 1, Column 2); short SDI with jitter (Table 1, Column 5). Post-stimulus images of evoked initial dip from a representative rat are provided here for each trial block (stimulus delivery indicated with a gray background bar) along with a plot of their peak locations. Compared to using a long SDI with jitter (left column), the initial dip for using a short SDI (middle and right columns) was readily observed to be comparable if not stronger whether there was jittering (right column) or not (middle column). In addition, for the short SDI, no apparent difference was observed whether jitter (right column) or no jitter (middle column) was used (see plot). (B) Response magnitude as a function of SDI. Three trial blocks were collected and summed together for each of six SDIs (no jitter): 3.0, 3.5, 4.0, 4.5, 5.0, and 5.5 sec within each of 3 rats. The initial dip peak magnitude was then determined and plotted as a function of SDI. An increase in magnitude was observed with increasing SDI in the range of 3.0–4.5 sec across all rats, with the trend less predictable for the SDI range of 5.0–5.5 sec. (C) Topographical mapping of activity evoked by individually stimulating several whiskers. Within the same rat, three trial blocks were collected for each of four whiskers: A2, B2, C2, and D2. All whiskers were individually stimulated in the same manner as described in the Materials and Methods section. Initial dip peak location was determined for each trial block and plotted. Note that the peak locations clustered according to whisker type and that the relative locations of the peak location clusters were consistent with the known anatomical topography of barrel cortex. Additional experiment details: Imaging was conducted as described in the Materials and Methods section except a 16-bit CCD camera (Cascade 512B II; Photometrics, Tucson, AZ) was used. Each trial block consisted of 64 trials in order to increase the total number of trial blocks collected per animal. We previously found that imaging results were comparable between 64 and 128 trials (Chen-Bee et al., 2007) and thus data analysis was performed on each 64-trial block for panels A and C. Care was given to collect different types of trial blocks in random order throughout the experiment day. Visualization and quantification was achieved as described in the Materials and Methods section.

Similar articles

Cited by

References

    1. Bandettini PA, Cox RW. Event-related fMRI contrast when using constant interstimulus interval: theory and experiment. Magn Reson Med. 2000;43:540–548. - PubMed
    1. Brett-Green BA, Chen-Bee CH, Frostig RD. Comparing the functional representations of central and border whiskers in rat primary somatosensory cortex. J Neurosci. 2001;21:9944–9954. - PMC - PubMed
    1. Chen-Bee CH, Agoncillo T, Xiong Y, Frostig RD. The triphasic intrinsic signal: implications for functional imaging. J Neurosci. 2007;27:4572–4586. - PMC - PubMed
    1. Chen-Bee CH, Kwon MC, Masino SA, Frostig RD. Areal extent quantification of functional representations using intrinsic signal optical imaging. J Neurosci Methods. 1996;68:27–37. - PubMed
    1. Chen-Bee CH, Polley DB, Brett-Green B, Prakash N, Kwon MC, Frostig RD. Visualizing and quantifying evoked cortical activity assessed with intrinsic signal imaging. J Neurosci Methods. 2000;97:157–173. - PubMed

Publication types

LinkOut - more resources