. 2010 Apr 15;50(3):902-9.
doi: 10.1016/j.neuroimage.2010.01.006. Epub 2010 Jan 14.

Focal BOLD fMRI changes in bicuculline-induced tonic-clonic seizures in the rat

Affiliations

Focal BOLD fMRI changes in bicuculline-induced tonic-clonic seizures in the rat

Matthew N DeSalvo et al. Neuroimage. .

Abstract

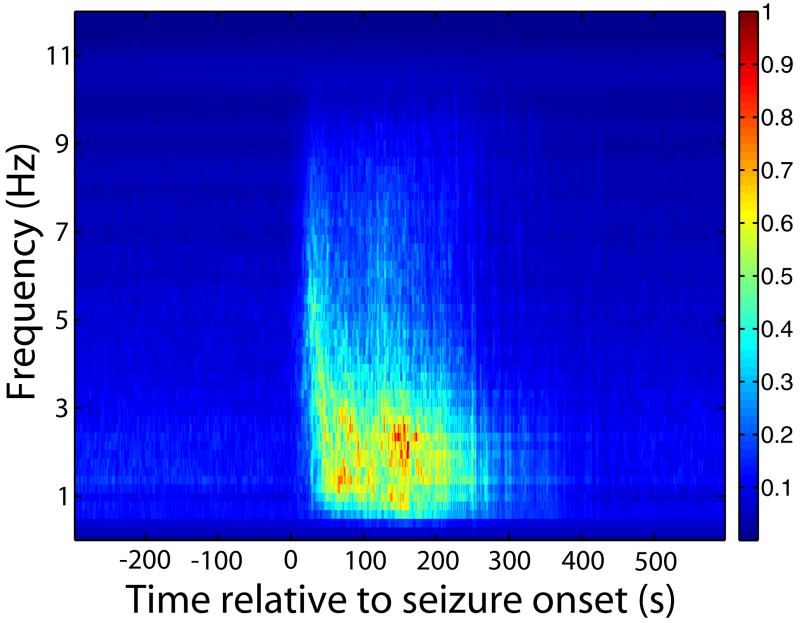
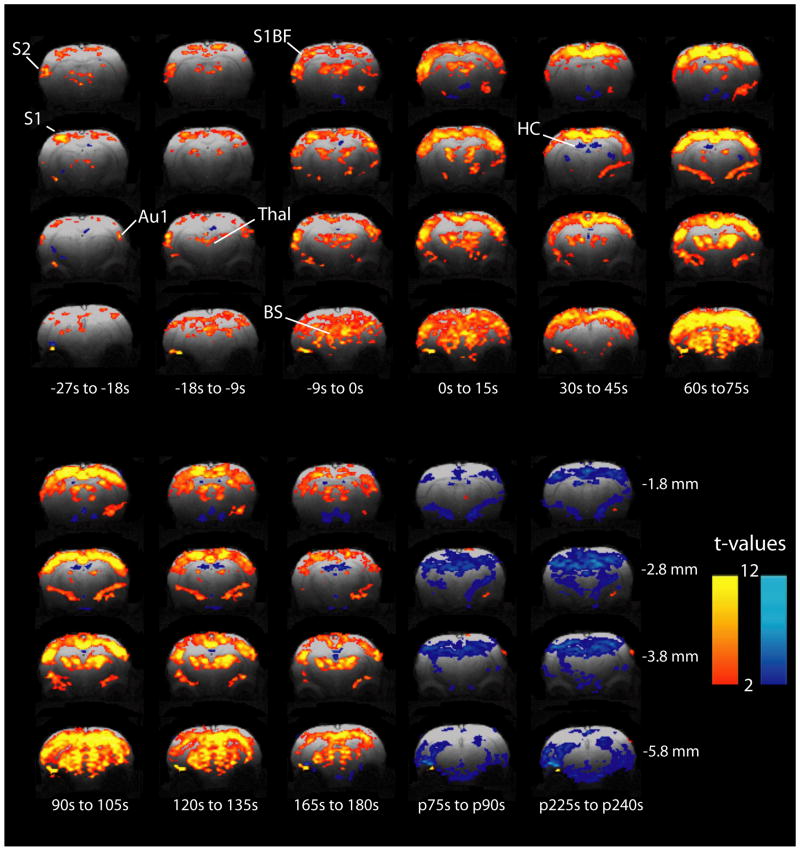
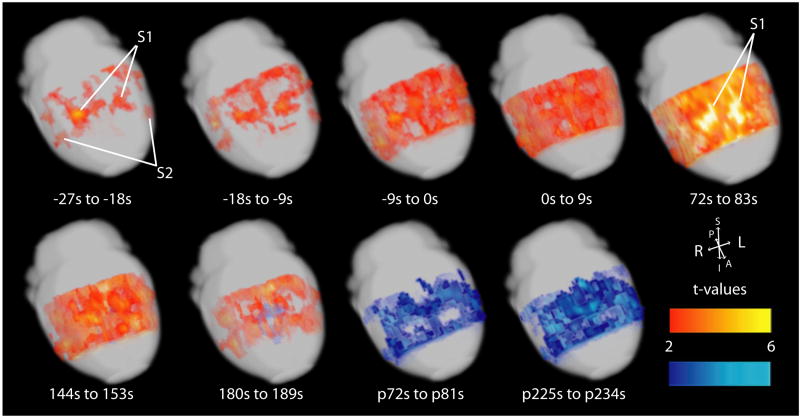
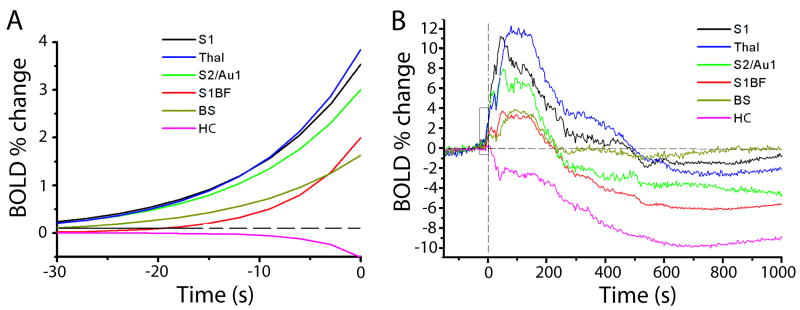
Generalized tonic-clonic seizures cause widespread physiological changes throughout the cerebral cortex and subcortical structures in the brain. Using combined blood oxygen level dependent (BOLD) functional magnetic resonance imaging (fMRI) at 9.4 T and electroencephalography (EEG), these changes can be characterized with high spatiotemporal resolution. We studied BOLD changes in anesthetized Wistar rats during bicuculline-induced tonic-clonic seizures. Bicuculline, a GABA(A) receptor antagonist, was injected systemically and seizure activity was observed on EEG as high-amplitude, high-frequency polyspike discharges followed by clonic paroxysmal activity of lower frequency, with mean electrographic seizure duration of 349 s. Our aim was to characterize the spatial localization, direction, and timing of BOLD signal changes during the pre-ictal, ictal and post-ictal periods. Group analysis was performed across seizures using paired t-maps of BOLD signal superimposed on high-resolution anatomical images. Regional analysis was then performed using volumes of interest to quantify BOLD timecourses. In the pre-ictal period we found focal BOLD increases in specific areas of somatosensory cortex (S1, S2) and thalamus several seconds before seizure onset. During seizures we observed BOLD increases in cortex, brainstem and thalamus and BOLD decreases in the hippocampus. The largest ictal BOLD increases remained in the focal regions of somatosensory cortex showing pre-ictal increases. During the post-ictal period we observed widespread BOLD decreases. These findings support a model in which "generalized" tonic-clonic seizures begin with focal changes before electrographic seizure onset, which progress to non-uniform changes during seizures, possibly shedding light on the etiology and pathophysiology of similar seizures in humans.


Figures

Figure 1
Figure 1
EEG time-frequency analysis across seizures. EEG signal power changes abruptly at seizure onset and offset. Analysis was performed using a short-time Fourier transform. Peak power was normalized to 1.0 before and after averaging. The dominant ictal signal frequency was 1∼3 Hz with higher frequency components up to ∼9-10 Hz occurring earlier and diminishing in power towards the end of seizures.
Figure 2
Figure 2
Focal fMRI increases begin in the preictal period and remain relatively increased after tonic-clonic seizure onset. Two-sample paired t-maps comparing BOLD signal of the specified time frame relative to electrographic seizure onset, to 30 s baseline signal. Times preceded by “p” indicate post-ictal and are relative to seizure offset. T-maps have been overlaid onto high resolution FLASH anatomical images with height threshold t>2.00 (p<0.05) and extent threshold of 13 voxels (2 mm3). Although images were acquired from +1.2 to -6.8 mm relative to bregma, representative slices are shown at -1.8, -2.8, -3.8 and -5.8 mm which encompass all volumes of interest. Similarly, representative timepoints only are shown during and after seizures. S1 = Primary somatosensory cortex subregions including hindlimb (S1HL), forelimb (S1FL), dysgranular zone (S1DZ), and trunk (S1Tr); S1BF = Primary somatosensory cortex, barrel field; S2 = Secondary somatosensory cortex; Au1 = Primary auditory cortex; Thal = Thalamus; HC = Hippocampus; BS = Brainstem. Warm colors represent fMRI increases and cool colors decreases.
Figure 3
Figure 3
Evolution of focal fMRI increases before and during tonic-clonic seizures displayed on brain surface. Two-sample paired t-maps comparing BOLD signal of the specified time frame, relative to electrographic seizure onset, to 30 s baseline signal. Representative timepoints only are shown during and after seizures. Times preceded by “p” indicate post-ictal and are relative to seizure offset. T-maps have been overlaid onto template anatomical images from the Karolinska rat atlas (http://mr.imaging-ks.nu/expmr.htm) with height threshold t>2.00 (p<0.05) and extent threshold of 250 voxels (2 mm3) and are displayed as 3-D cortical surface renderings. S1 = Primary somatosensory cortex subregions including hindlimb (S1HL), forelimb (S1FL), dysgranular zone (S1DZ), and trunk (S1Tr); S2 = Secondary somatosensory cortex. Warm colors represent fMRI increases and cool colors decreases.
Figure 4
Figure 4
Timecourses of percent change in BOLD signal compared to 30 s baseline signal in various regions. Times are relative to seizure onset. A. Exponential fits to mean timecourses 30s before seizure onset (fit to data from times in box, B). ANOVA across seizures and regions (F=10.75, P<0.01, df =5, 96) with post-hoc pairwise comparisons reveals 3 groupings from fastest to slowest: S1, S2/Au1 and thalamus (mean=0.16 s-1); S1BF and brainstem (0.05 s-1); and hippocampus (∼0.01 s-1). B. Full timecourses of mean percent changes in BOLD reveal different peak amplitudes in different regions. ANOVA across seizures and regions (F= 24.34, P<0.001, df= 5, 96) with post-hoc comparisons demonstrated the following 4 groups from largest increase to largest decrease: S1 and thalamus (mean=12.35%); S2/Au1 (8.56%); S1BF and brainstem (4.21%); and finally hippocampus (-10.14%). S1= Primary somatosensory cortex excluding S1BF, but including hindlimb (S1HL), forelimb (S1FL), dysgranular zone (S1DZ), and trunk (S1Tr); S1BF = Primary somatosensory cortex, barrel field; S2 = Secondary somatosensory cortex; Au1 = Primary auditory cortex; Thal = Thalamus; HC = Hippocampus; BS = Brainstem.

Similar articles

Cited by

References

    1. Ackermann RF, Engel J, Jr, Baxter L. Positron emission tomography and autoradiographic studies of glucose utilization following electroconvulsive seizures in humans and rats. Annals of the New York Academy of Sciences. 1986;462:263–269. - PubMed
    1. Andre V, Henry D, Nehlig A. Dynamic variations of local cerebral blood flow in maximal electroshock seizures in the rat. Epilepsia. 2002;43:1120–1128. - PubMed
    1. Benner T, van der Kouwe AJ, Kirsch JE, Sorensen AG. Real-time RF pulse adjustment for B0 drift correction. Magn Reson Med. 2006;56:204–209. - PubMed
    1. Blumenfeld H, McNally KA, Ostroff RB, Zubal IG. Targeted prefrontal cortical activation with bifrontal ECT. Psychiatry Res. 2003a;123:165–170. - PubMed
    1. Blumenfeld H, Varghese GI, Purcaro MJ, Motelow JE, Enev M, McNally KA, Levin AR, Hirsch LJ, Tikofsky R, Zubal IG, Paige AL, Spencer SS. Cortical and subcortical networks in human secondarily generalized tonic-clonic seizures. Brain. 2009;132:999–1012. - PMC - PubMed

Publication types