

Human efficiency for classifying natural versus random text
- PMID: 20079757
- PMCID: PMC2832918
- DOI: 10.1016/j.visres.2009.12.015
Human efficiency for classifying natural versus random text
Abstract
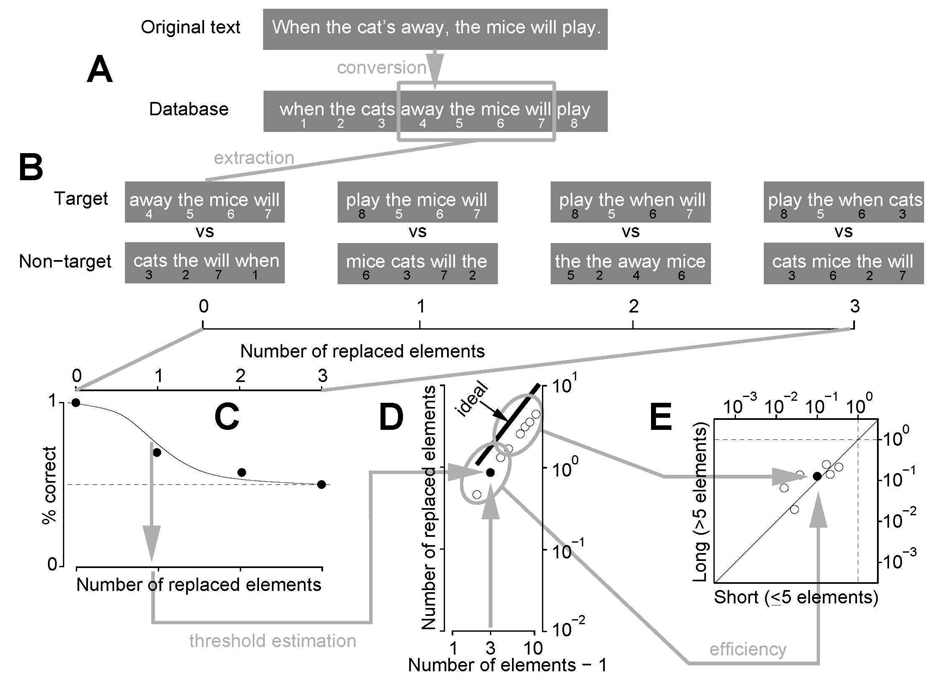
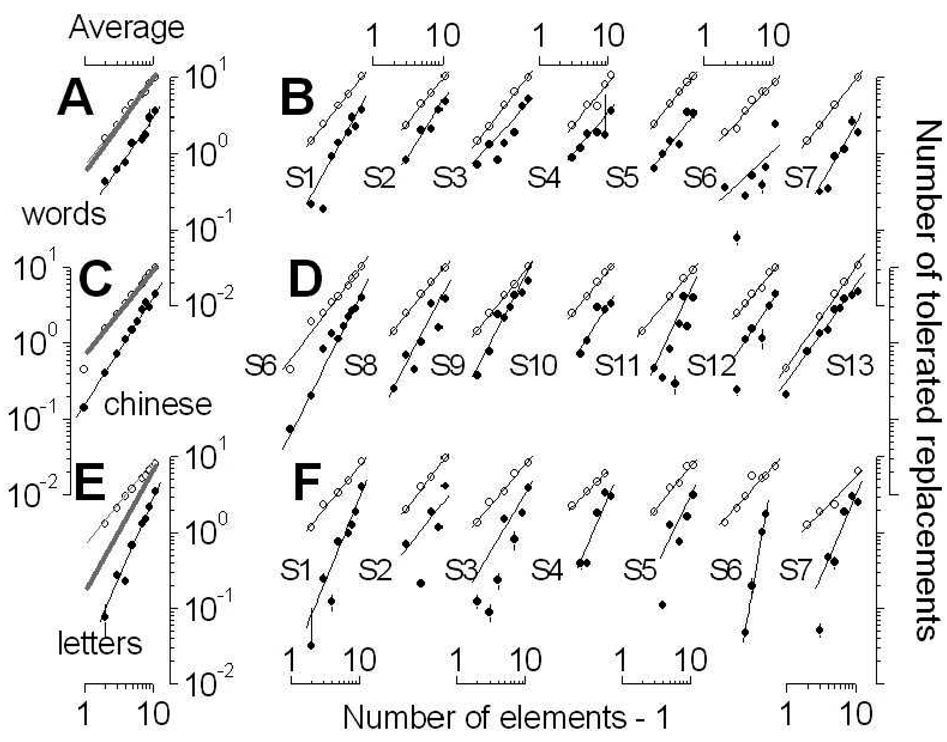
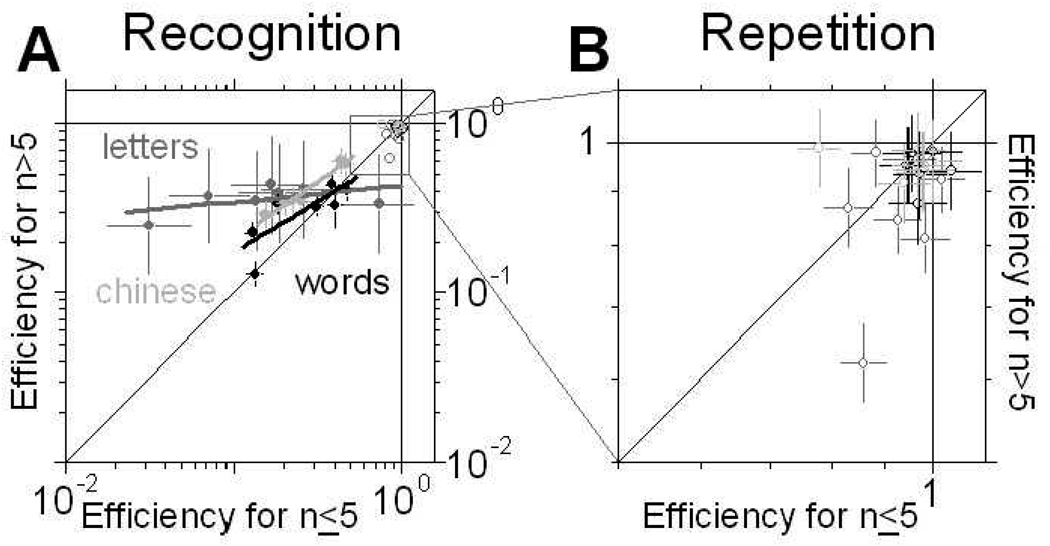
Humans are remarkably efficient at processing natural text. We quantified efficiency for discriminating a sample of meaningful text from a sample of random text by disrupting the meaningful sample, and measuring how much disruption human readers can tolerate before the two samples become indistinguishable. We performed these measurements for a wide range of conditions, involving samples of different lengths and containing letters, words or Chinese characters. We then compared human performance to the best possible performance achieved by a Bayesian estimator under the conditions in which we tested our participants, and in so doing we determined their absolute efficiency. Values were mostly in the range 5-40%, in agreement with reported efficiencies for many visual tasks. Although not intended as a veridical model of human processing, we found that the Bayesian model captured some (but not all) aspects of how humans classified text in our tasks and conditions.
Copyright 2010 Elsevier Ltd. All rights reserved.
Figures
Similar articles
-
A compositional neural code in high-level visual cortex can explain jumbled word reading.Elife. 2020 May 5;9:e54846. doi: 10.7554/eLife.54846. Elife. 2020. PMID: 32369017 Free PMC article.
-
Vibrotactile masking experiments reveal accelerated somatosensory processing in congenitally blind braille readers.J Neurosci. 2010 Oct 27;30(43):14288-98. doi: 10.1523/JNEUROSCI.1447-10.2010. J Neurosci. 2010. PMID: 20980584 Free PMC article.
-
A Bayesian observer model reveals a prior for natural daylights in hue perception.Vision Res. 2024 Jul;220:108406. doi: 10.1016/j.visres.2024.108406. Epub 2024 Apr 15. Vision Res. 2024. PMID: 38626536
-
Folic acid supplementation and malaria susceptibility and severity among people taking antifolate antimalarial drugs in endemic areas.Cochrane Database Syst Rev. 2022 Feb 1;2(2022):CD014217. doi: 10.1002/14651858.CD014217. Cochrane Database Syst Rev. 2022. PMID: 36321557 Free PMC article.
-
Crowding and eccentricity determine reading rate.J Vis. 2007 Oct 26;7(2):20.1-36. doi: 10.1167/7.2.20. J Vis. 2007. PMID: 18217835 Review.
References
-
- Barlow HB. The efficiency of detecting changes of density in random dot patterns. Vision Research. 1978;18:637–650. - PubMed
-
- Barlow HB. The absolute efficiency of perceptual decisions. Phil. Trans. R. Soc. Lond. B. 1980;290:71–82. - PubMed
-
- Burgess AE, Colborne B. Visual signal detection. IV. Observer inconsistency. J. Opt. Soc. Am. A. 1988;5:617–627. - PubMed
-
- Burgess AE, Wagner RF, Jennings RJ, Barlow HB. Efficiency of human visual signal discrimination. Science. 1981;214:93–94. - PubMed
Publication types
MeSH terms
Grants and funding
LinkOut - more resources
Full Text Sources
