

Conservation and regulatory associations of a wide affinity range of mouse transcription factor binding sites
- PMID: 20079828
- PMCID: PMC2848887
- DOI: 10.1016/j.ygeno.2010.01.002
Conservation and regulatory associations of a wide affinity range of mouse transcription factor binding sites
Abstract
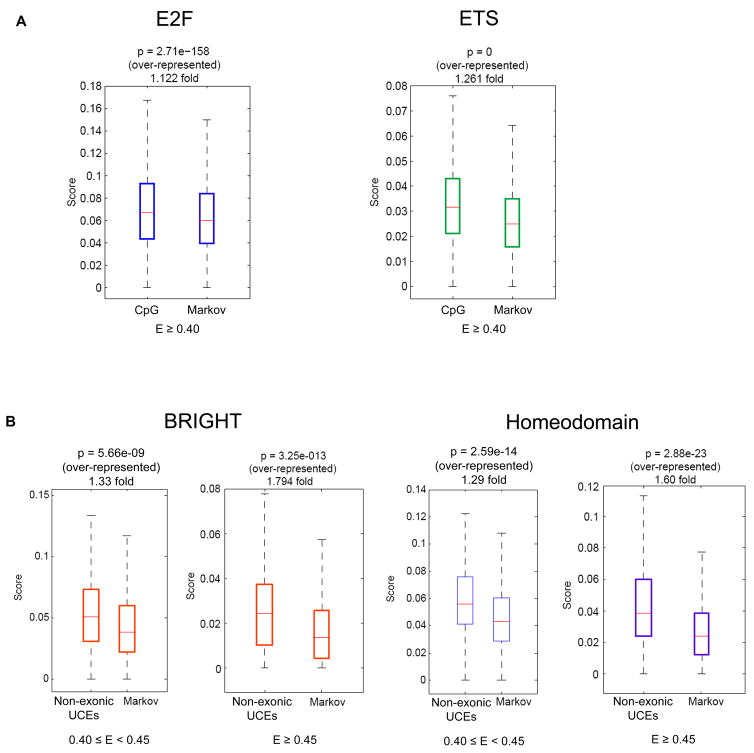
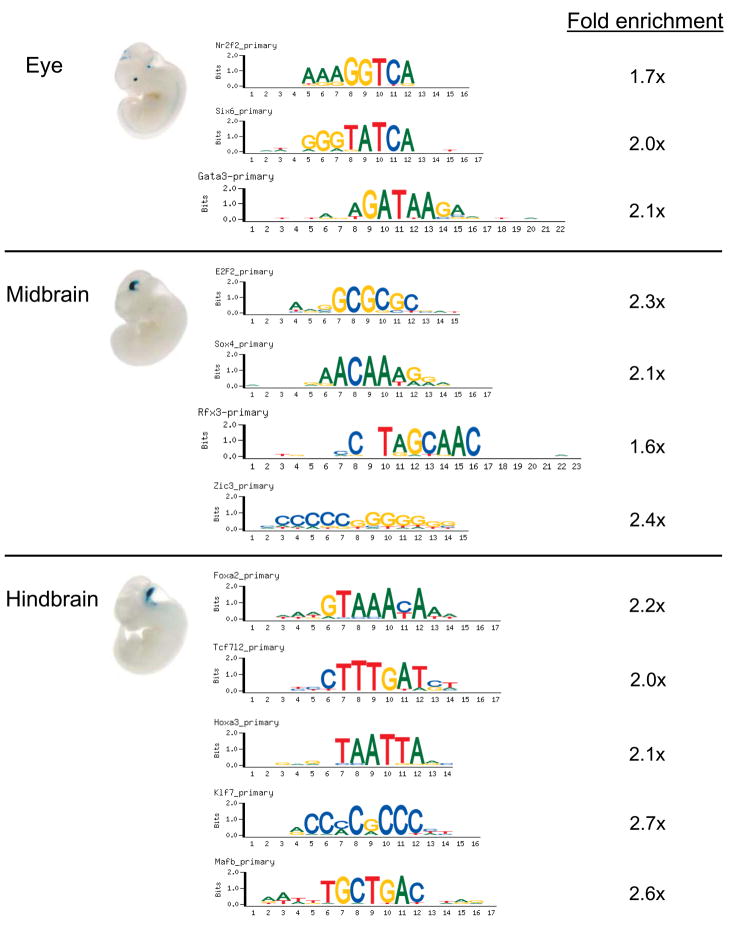
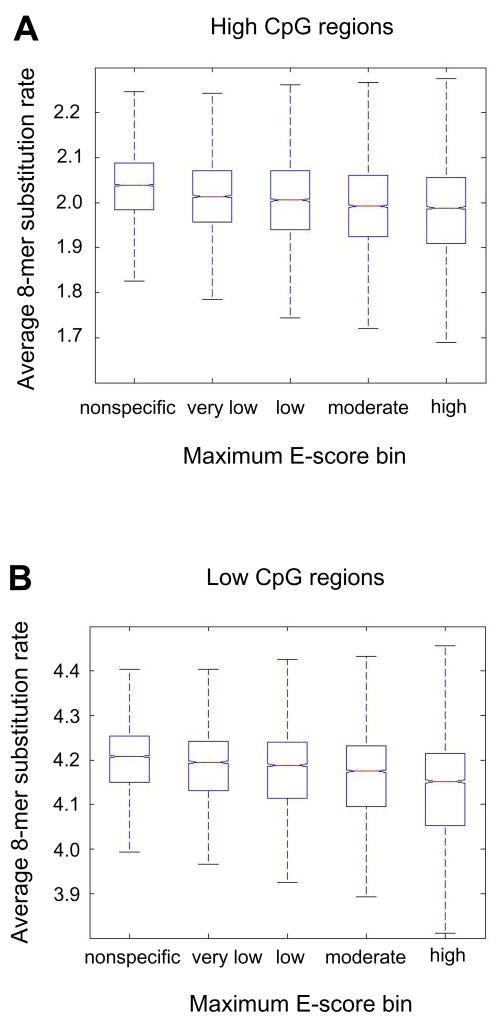
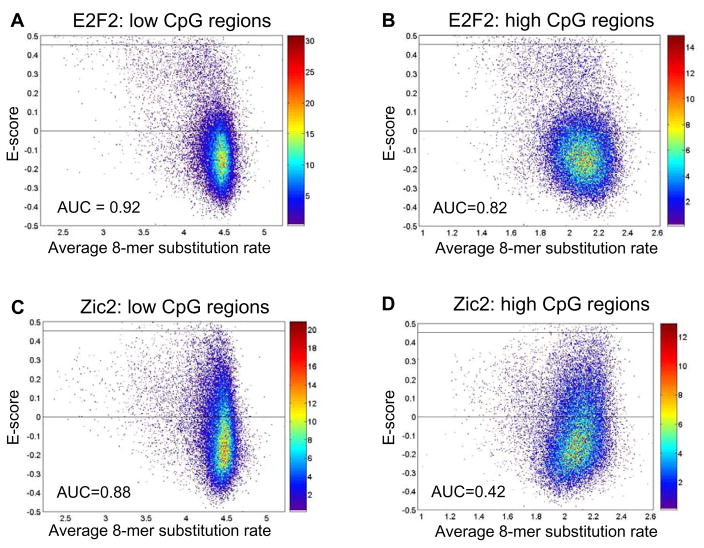
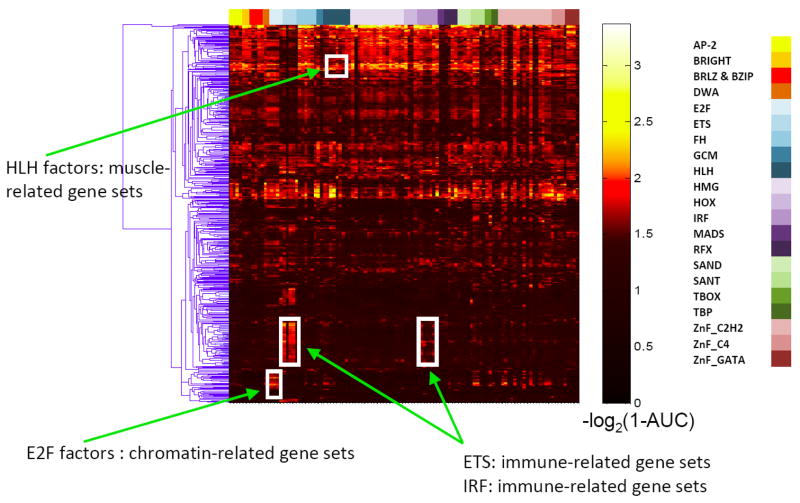
Sequence-specific binding by transcription factors (TFs) interprets regulatory information encoded in the genome. Using recently published universal protein binding microarray (PBM) data on the in vitro DNA binding preferences of these proteins for all possible 8-base-pair sequences, we examined the evolutionary conservation and enrichment within putative regulatory regions of the binding sequences of a diverse library of 104 nonredundant mouse TFs spanning 22 different DNA-binding domain structural classes. We found that not only high affinity binding sites, but also numerous moderate and low affinity binding sites, are under negative selection in the mouse genome. These 8-mers occur preferentially in putative regulatory regions of the mouse genome, including CpG islands and non-exonic ultraconserved elements (UCEs). Of TFs whose PBM "bound" 8-mers are enriched within sets of tissue-specific UCEs, many are expressed in the same tissue(s) as the UCE-driven gene expression. Phylogenetically conserved motif occurrences of various TFs were also enriched in the noncoding sequence surrounding numerous gene sets corresponding to Gene Ontology categories and tissue-specific gene expression clusters, suggesting involvement in transcriptional regulation of those genes. Altogether, our results indicate that many of the sequences bound by these proteins in vitro, including lower affinity DNA sequences, are likely to be functionally important in vivo. This study not only provides an initial analysis of the potential regulatory associations of 104 mouse TFs, but also presents an approach for the functional analysis of TFs from any other metazoan genome as their DNA binding preferences are determined by PBMs or other technologies.
Copyright 2010 Elsevier Inc. All rights reserved.
Figures
Similar articles
-
GPMiner: an integrated system for mining combinatorial cis-regulatory elements in mammalian gene group.BMC Genomics. 2012;13 Suppl 1(Suppl 1):S3. doi: 10.1186/1471-2164-13-S1-S3. Epub 2012 Jan 17. BMC Genomics. 2012. PMID: 22369687 Free PMC article.
-
Imprinted genes show unique patterns of sequence conservation.BMC Genomics. 2010 Nov 22;11:649. doi: 10.1186/1471-2164-11-649. BMC Genomics. 2010. PMID: 21092170 Free PMC article.
-
All and only CpG containing sequences are enriched in promoters abundantly bound by RNA polymerase II in multiple tissues.BMC Genomics. 2008 Feb 5;9:67. doi: 10.1186/1471-2164-9-67. BMC Genomics. 2008. PMID: 18252004 Free PMC article.
-
Sequence determinants, function, and evolution of CpG islands.Biochem Soc Trans. 2021 Jun 30;49(3):1109-1119. doi: 10.1042/BST20200695. Biochem Soc Trans. 2021. PMID: 34156435 Free PMC article. Review.
-
Low-Affinity Binding Sites and the Transcription Factor Specificity Paradox in Eukaryotes.Annu Rev Cell Dev Biol. 2019 Oct 6;35:357-379. doi: 10.1146/annurev-cellbio-100617-062719. Epub 2019 Jul 5. Annu Rev Cell Dev Biol. 2019. PMID: 31283382 Free PMC article. Review.
Cited by
-
Genome-wide computational analysis of dioxin response element location and distribution in the human, mouse, and rat genomes.Chem Res Toxicol. 2011 Apr 18;24(4):494-504. doi: 10.1021/tx100328r. Epub 2011 Mar 17. Chem Res Toxicol. 2011. PMID: 21370876 Free PMC article.
-
An improved predictive recognition model for Cys(2)-His(2) zinc finger proteins.Nucleic Acids Res. 2014 Apr;42(8):4800-12. doi: 10.1093/nar/gku132. Epub 2014 Feb 12. Nucleic Acids Res. 2014. PMID: 24523353 Free PMC article.
-
Abnormal dosage of ultraconserved elements is highly disfavored in healthy cells but not cancer cells.PLoS Genet. 2014 Oct 23;10(10):e1004646. doi: 10.1371/journal.pgen.1004646. eCollection 2014 Oct. PLoS Genet. 2014. PMID: 25340765 Free PMC article.
-
Absence of a simple code: how transcription factors read the genome.Trends Biochem Sci. 2014 Sep;39(9):381-99. doi: 10.1016/j.tibs.2014.07.002. Epub 2014 Aug 14. Trends Biochem Sci. 2014. PMID: 25129887 Free PMC article. Review.
-
CpG islands and the regulation of transcription.Genes Dev. 2011 May 15;25(10):1010-22. doi: 10.1101/gad.2037511. Genes Dev. 2011. PMID: 21576262 Free PMC article. Review.
References
-
- Segal E, Raveh-Sadka T, Schroeder M, Unnerstall U, Gaul U. Predicting expression patterns from regulatory sequence in Drosophila segmentation. Nature. 2008;451:535–40. - PubMed
Publication types
MeSH terms
Substances
Grants and funding
LinkOut - more resources
Full Text Sources
