. 2010 Apr;138(4):1536-45.
doi: 10.1053/j.gastro.2010.01.006. Epub 2010 Jan 18.

Activation of natural killer cells during acute infection with hepatitis C virus

Affiliations

Activation of natural killer cells during acute infection with hepatitis C virus

Barbara Amadei et al. Gastroenterology. 2010 Apr.

Abstract

Background & aims: Natural killer (NK) cells are essential early after infection, not only for viral containment but also for timely and efficient induction of adaptive responses. An inhibitory effect of hepatitis C virus (HCV)-E2 proteins on NK cells has been reported, but the features of NK cell responses in the acute phase of hepatitis C are still largely undefined. Therefore, the aim of this study was to characterize the function and phenotype of NK cells in the acute phase of infection and compare individuals with chronic and self-limited outcomes.

Methods: Twenty-two individuals with acute HCV infection, 14 with chronic evolution, and 8 with self-limited infection, were studied using NK phenotypic and functional assays.

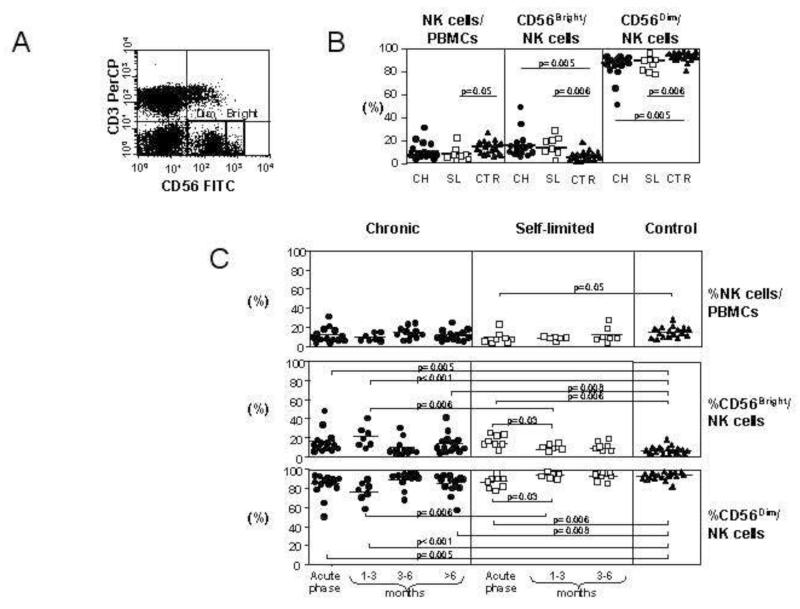
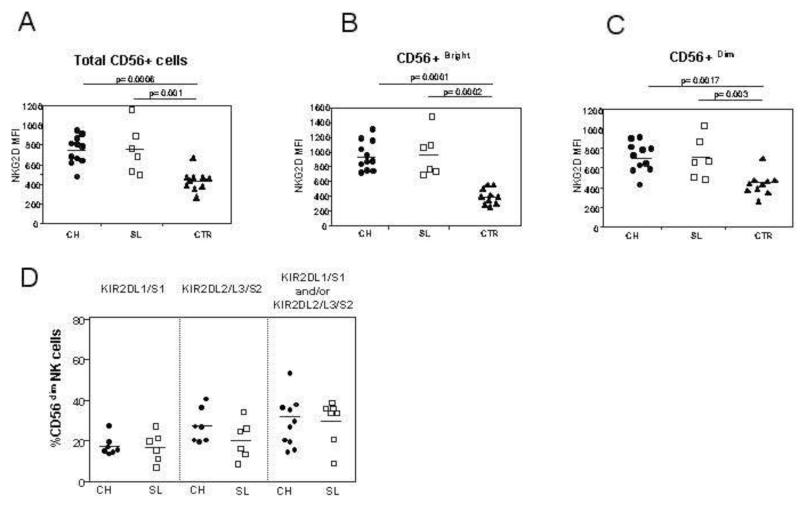
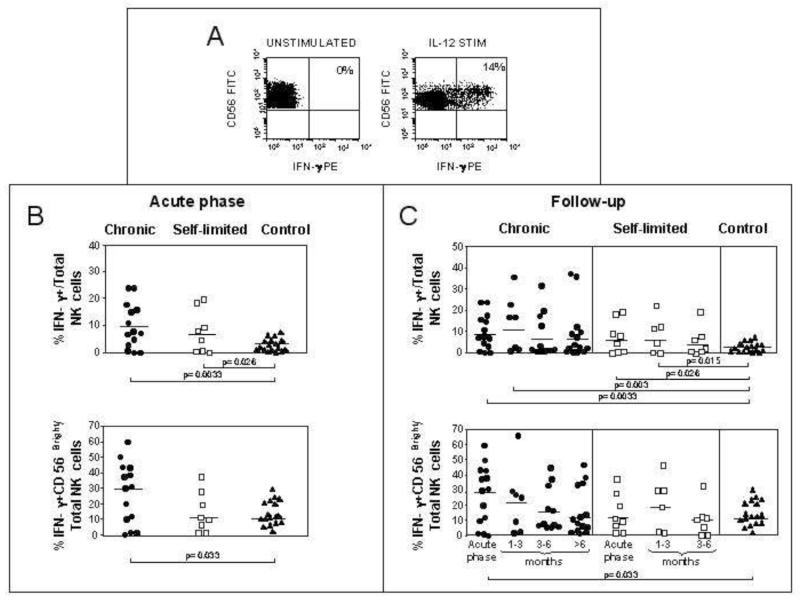
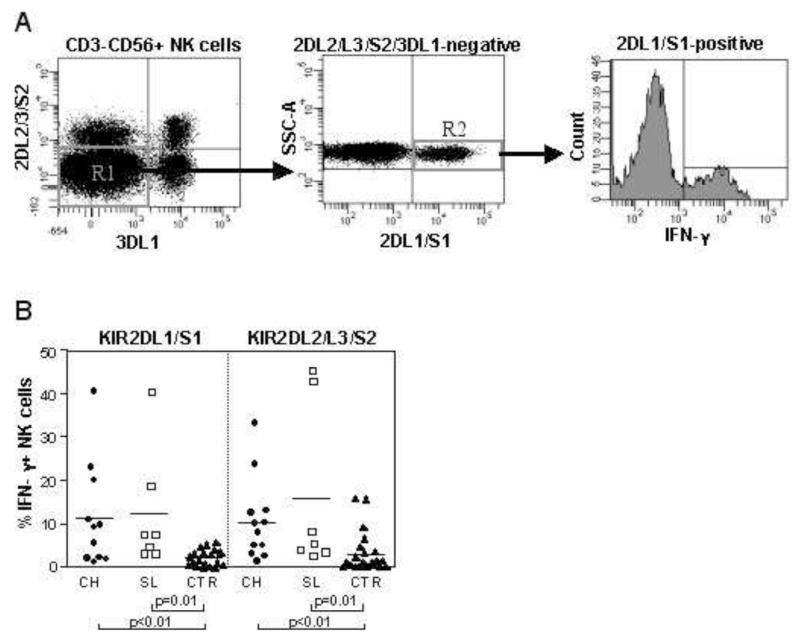
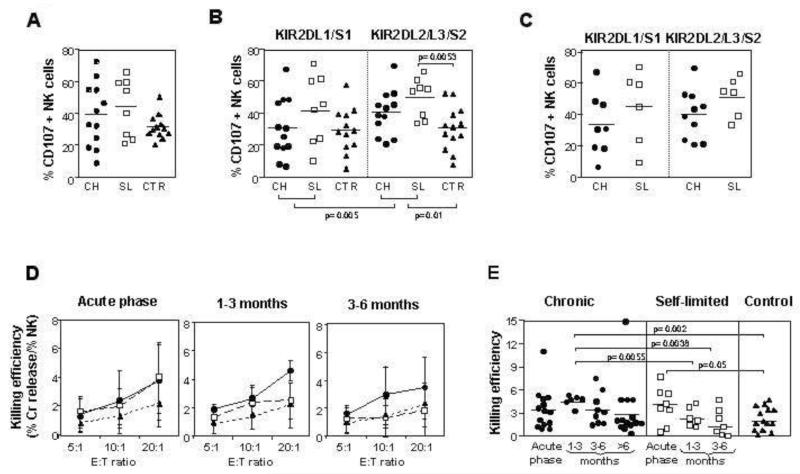
Results: An increased expression of NKG2D on both CD56(bright) and CD56(dim) NK cells was detected in patients with acute HCV, irrespective of the outcome, as compared with healthy controls. Also, interferon gamma production and cytotoxicity by NK cells were higher in individuals with acute HCV infection than in healthy controls. Subset analysis showed increased interferon gamma production in both NK cell subsets carrying group 1 and group 2 HLA-C-specific killer cell immunoglobulin-like receptors. However, increased CD107a was noted only on NK cells expressing the group 1 HLA-C-specific killer cell immunoglobulin-like receptor and was maximal in self-limited infection.

Conclusions: Our data show that in the acute phase of HCV infection, NK cells are activated regardless of outcome, with no evidence of a suppressive effect of HCV on NK cell function.


Figures

Figure 1
Figure 1. Changes in NK cell subsets during acute HCV infection
Panel A: representative flow cytometry dot plot of the CD56bright CD3 and CD56dim CD3 populations in acute HCV infection. Panel B: frequency of NK cells as a percentage of the lymphocyte population and the frequencies of CD56bright and CD56dim NK cells as a percentage of the total NK population in 14 chronically evolving patients (CH, circles), 8 self-limited patients (SL, squares) and 17 healthy controls (CTR, triangles). Panel C: changes in NK cells in the follow-up phase of infection. The upper panel shows NK cells as a percentage of the live lymphocyte gate, and the middle and lower panels show the relative proportions of CD56bright (middle) and CD56dim (lower) NK cells.
Figure 2
Figure 2. NK cell receptor expression in the three patient populations
Panels A-C: NKG2D expression on total NK cells (A), on CD56bright NK cells (B) and on CD56dim NK cells (C). The expression of these receptors in the acute phase are compared between 11 patients with acute HCV infection and chronic evolution (CH, circles), 6 with self-limited infection (SL, squares) and 10 healthy controls (CTR, triangles). Panel D: percentage of NK cells expressing specific KIR molecules in the acute phase of infection, as determined by GL183 (anti-KIR2DL2/3/S2) and EB6 (anti-KIR2DL1/S1) in individuals with acute HCV infection. The left panel shows the frequency of KIR2DL1/S1 NK cells in individuals with group 2 HLA-C allotypes; the middle panel shows the frequency of KIR2DL2/3/S2 in individuals with group 1 HLA-C alleles and the right panel shows the total number of NK cells expressing a KIR cognate for the HLA-C alleles of the individual (either group1 HLA-C, group 2 HLA-C or both group 1 and group 2 HLA-C).
Figure 3
Figure 3. Increased production of IFN-γ by NK cells
PBMCs were incubated overnight with or without IL-12. The cells were then stained with mAbs to detect IFN-γ and identify NK cells (CD56+ CD3). Panel A: representative flow cytometry dot plots of IFN-γ producing cells following overnight culture with or without IL-12. Panel B: percentage of IFN-γ+ total NK (upper plot) and IFN-γ+ CD56bright NK cells (lower plot) in IL-12 stimulated PBMC in the various patient populations in the acute phase of infection (8 self-limited, 14 chronically evolving, 17 controls). Panel C: IFN-γ production during the follow-up phase of HCV infection in individuals with self-limited and chronic hepatitis on total NK cells and on CD56bright NK cells.
Figure 4
Figure 4. Activation of KIR+ NK cells during acute HCV infection
Panel A: representative flow cytometry dot plot to illustrate the gating strategy used to obtain NK cells single positive (SP) for one specific KIR group, in this case KIR2DL1/S1. In this plot CD3 CD56dim NK cells were gated and NK cells negative for both KIR2DL2/L3/S2 and KIR3DL1 were analysed for expression of KIR2DL1/S1. The histogram shows IFN-γ production by these KIR2DL1/S1 positive NK cells. Panel B: percentage of IFN-γ producing NK cells single positive for KIR2DL1/S1 or KIR2DL2/3/S2 in the acute phase of infection in patients with acute hepatitis and healthy controls. Circles depict patients with chronically evolving infection (n=12), squares individuals with self-limited infection (n=7) and triangles represent the controls (n=17).
Figure 5
Figure 5. Up-regulation of NK cell degranulation and cytotoxicity during acute HCV infection
Degranulation, assessed by surface expression of CD107a, was measured in IL-15 stimulated NK cells following co-culture with K562 target cells. Panel A: the percentage of degranulating CD56dim NK cells, analyzed in the acute phase, is compared between 12 patients with acute HCV infection and chronic evolution, 8 patients with self-limited infection and 11 healthy controls. No statistically significant differences were found between the groups. Panel B: percentage of NK cells single positive for KIR2DL1/S1 or KIR2DL2/3/S2 that express CD107a in the acute phase in individuals with acute hepatitis and in the healthy controls. Circles depict individuals with chronic infection, squares those with self-limited infection and triangles represent the controls. Comparisons by Mann-Whitney U test revealed significant differences in CD107 upregulation between NK cells single positive for KIR2DL2/L3/S2 in the total patient population, as well as in the self-limited group compared with healthy controls. A statistical difference was also detected between NK cells single positive for KIR2DL1/S1 and those single positive for KIR2DL2/L3/S2 in the whole patient population. Panel C: comparison of CD107a expression on KIR2DL1/S1 or KIR2DL2/3/S2 NK cells in the acute phase in HCV infected individuals who have the cognate HLA-C ligand (group 2 and group 1 respectively). Individuals with chronic evolution are depicted with closed circles and those with self-limited hepatitis with open squares. No statistically significant differences were found between the different types of infection. Panel D: cytotoxic activity in the acute and follow-up phases of infection normalised for NK cell number, as tested by 51Cr-release assay against K562 cells. Results are shown for individuals with chronic evolution of acute infection (circles and full line), self-limited infection (squares and dashed line) and 14 healthy controls (triangles and dotted line) at varying effector to target (E:T) ratios. Fourteen individuals with chronic evolution and 8 with self-limited infection were evaluated in the acute phase; 6 in each group at one to three months, and 9 with chronic evolution and 7 with self-limited at three to six months. The mean and standard deviations are shown. Panel E: cytotoxicity against K562 targets normalized for NK cell number in the acute phase and early follow-up phase of infection at the E:T ratio of 20:1. The numbers of patients and controls are the same as those illustrated in panel D, with 14 additional chronic patients analyzed at later follow-up time points.

Similar articles

Cited by

References

    1. Rehermann B, Nascimbeni M. Immunology of hepatitis B virus and hepatitis C virus infection. Nat Rev Immunol. 2005;5:215–29. - PubMed
    1. Rehermann B. Hepatitis C virus versus innate and adaptive immune responses: a tale of coevolution and coexistence. J Clin Invest. 2009;119:1745–54. - PMC - PubMed
    1. Bowen D, Walker CM. Adaptive immune responses in acute and chronic hepatitis C virus infection. Nature. 2005;436:946–52. - PubMed
    1. Moretta A, Marcenaro E, Parolini S, Ferlazzo G, Moretta L. Nk cells at the interface between innate and adaptive immunity. Cell Death Differ. 2008;15:226–33. - PubMed
    1. Doherty DG, Norris S, Madrigal-Estebas L, McEntee G, Traynor O, Hegarty JE, O’Farrelly C. The human liver contains multiple populations of NK cells, T cells, and CD3+CD56+ natural T cells with distinct cytotoxic activities and Th1, Th2, and Th0 cytokine secretion patterns. J Immunol. 1999;163:2314–21. - PubMed

Publication types