. 2010 Mar 19;397(1):260-77.
doi: 10.1016/j.jmb.2009.12.051. Epub 2010 Jan 18.

Interactions between PTB RRMs induce slow motions and increase RNA binding affinity

Affiliations

Interactions between PTB RRMs induce slow motions and increase RNA binding affinity

Caroline M Maynard et al. J Mol Biol. .

Abstract

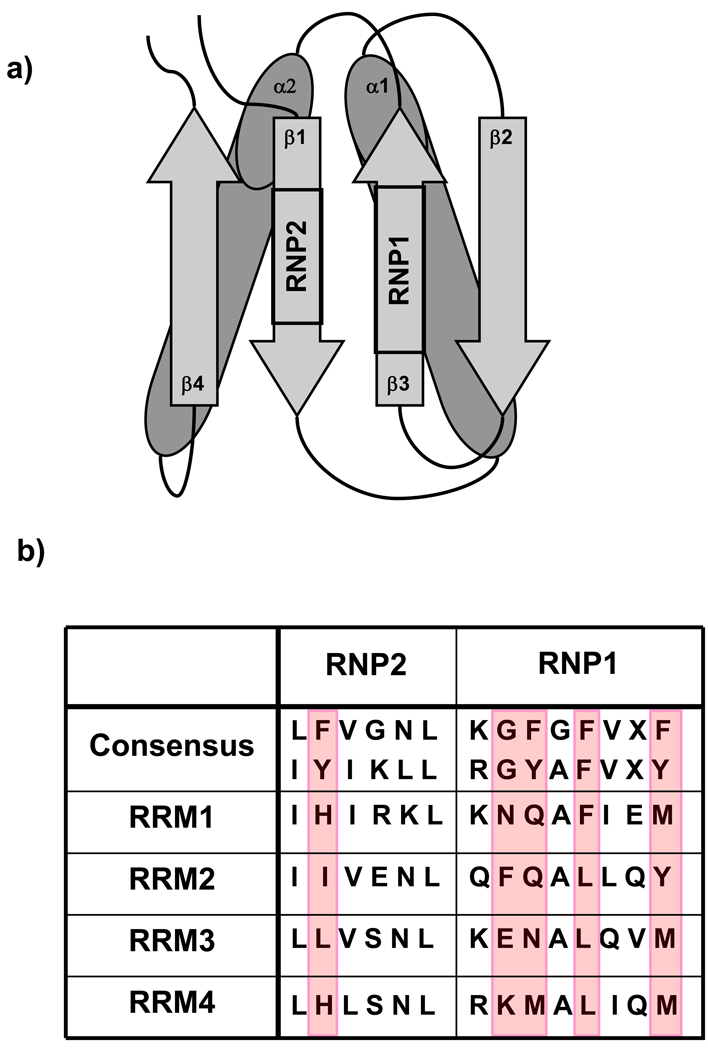
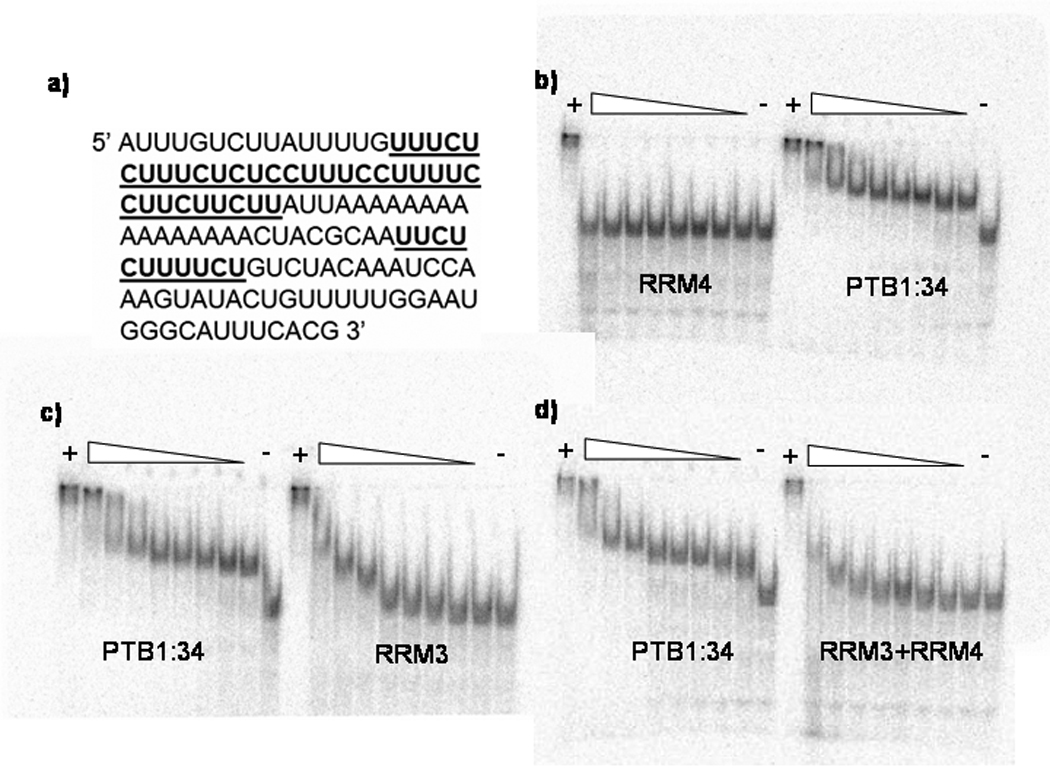
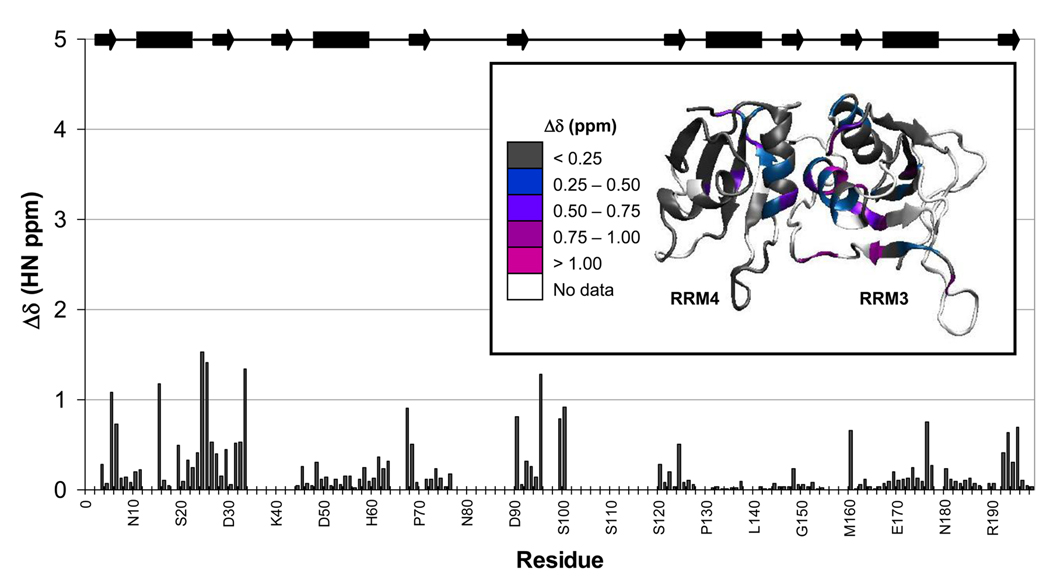
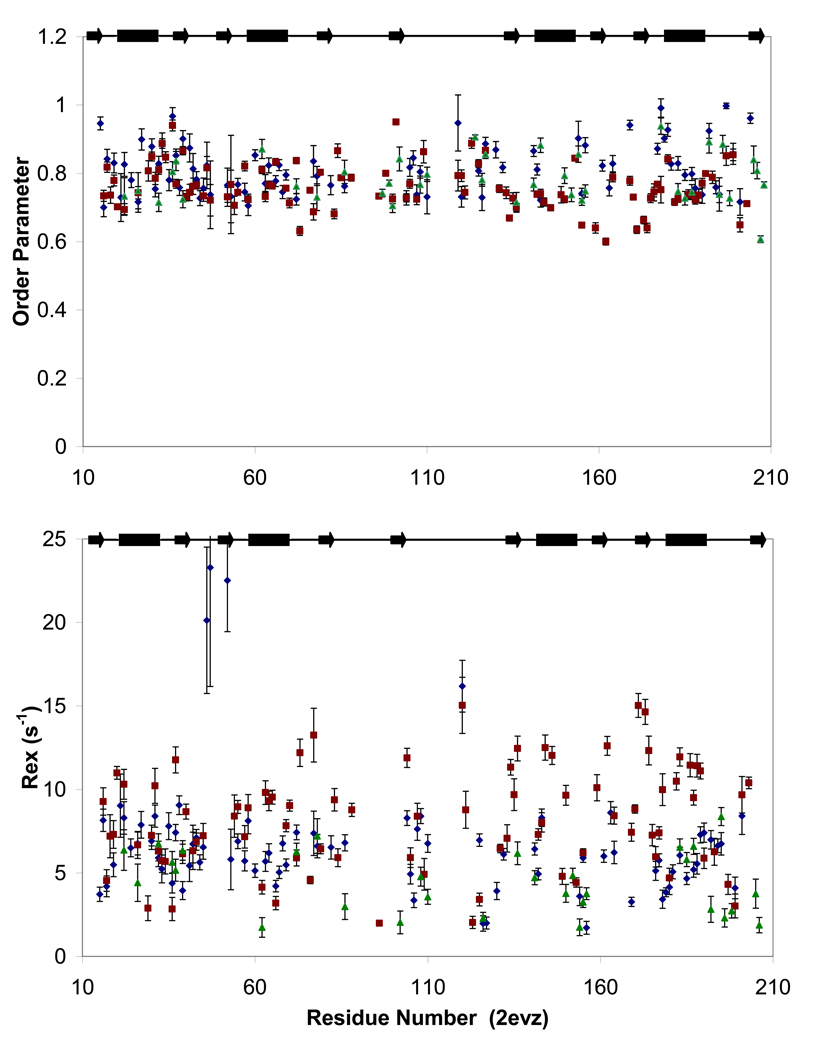
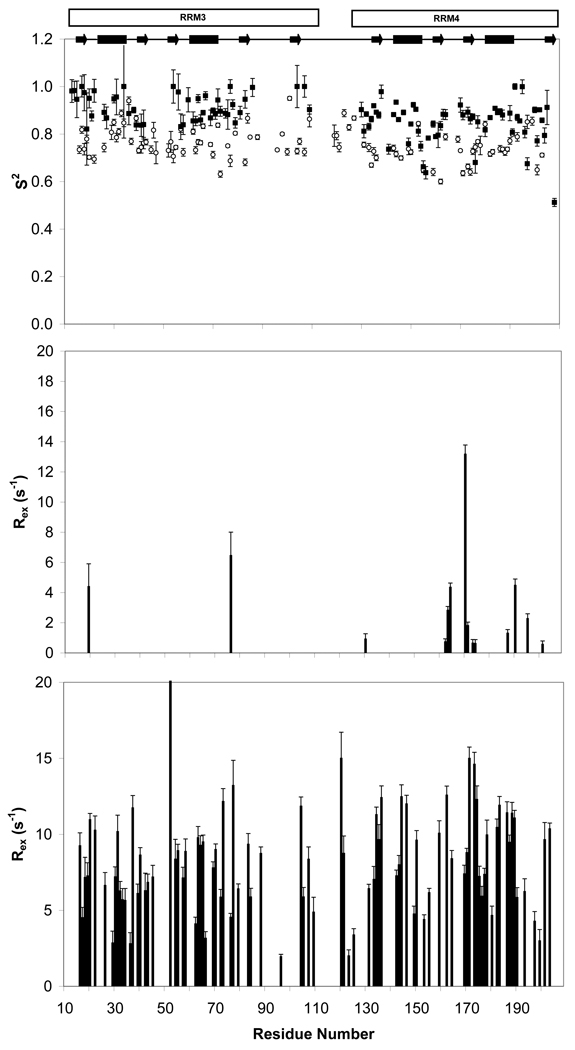
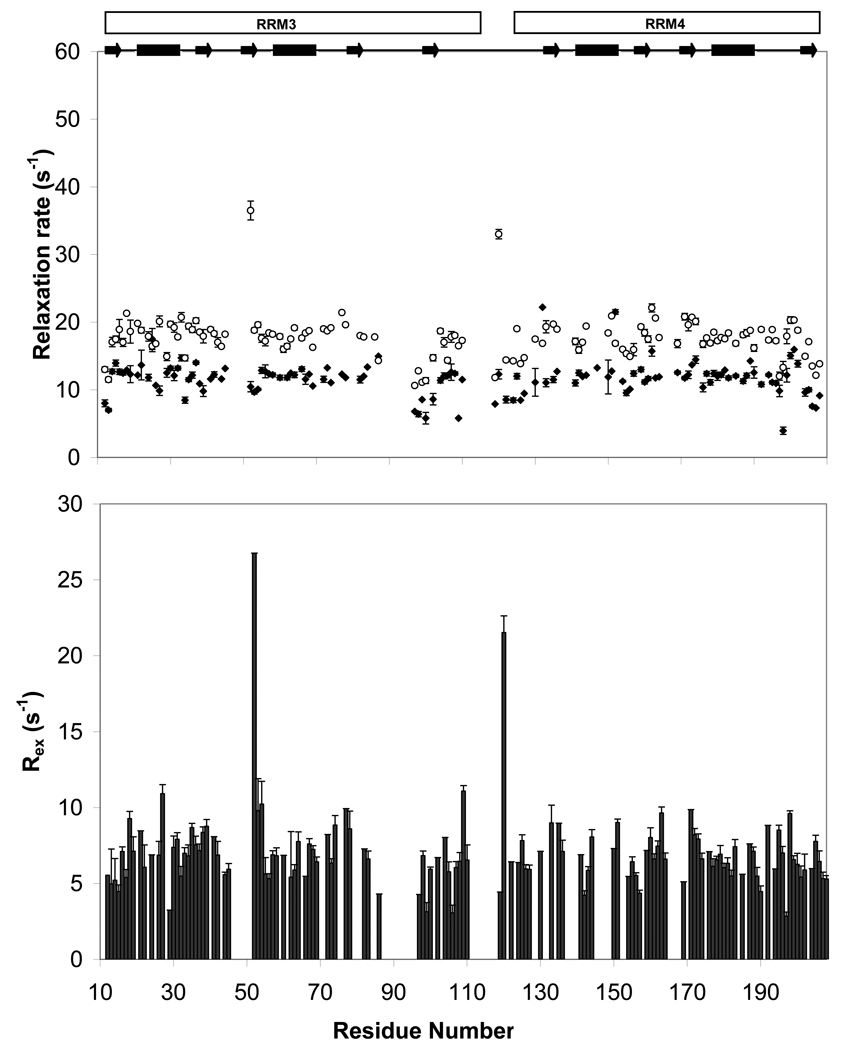
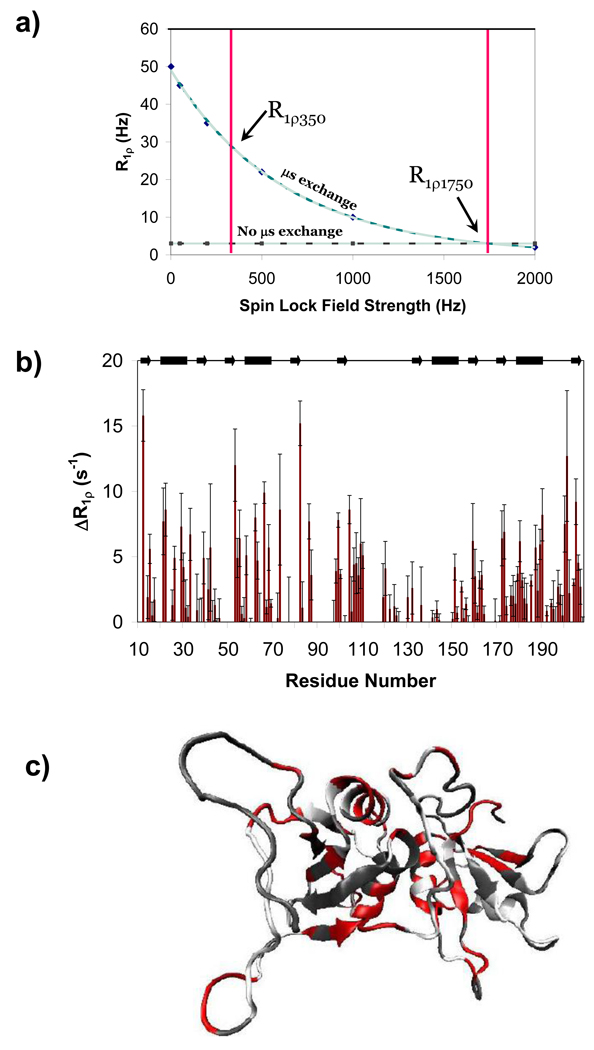
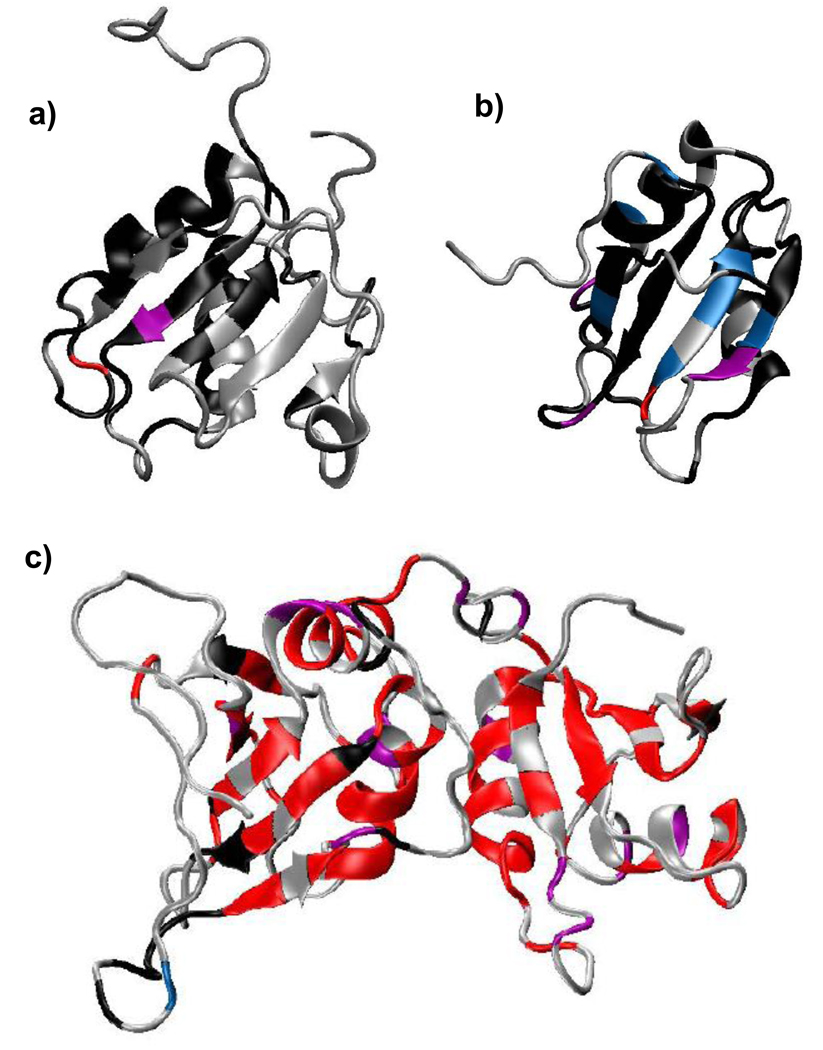
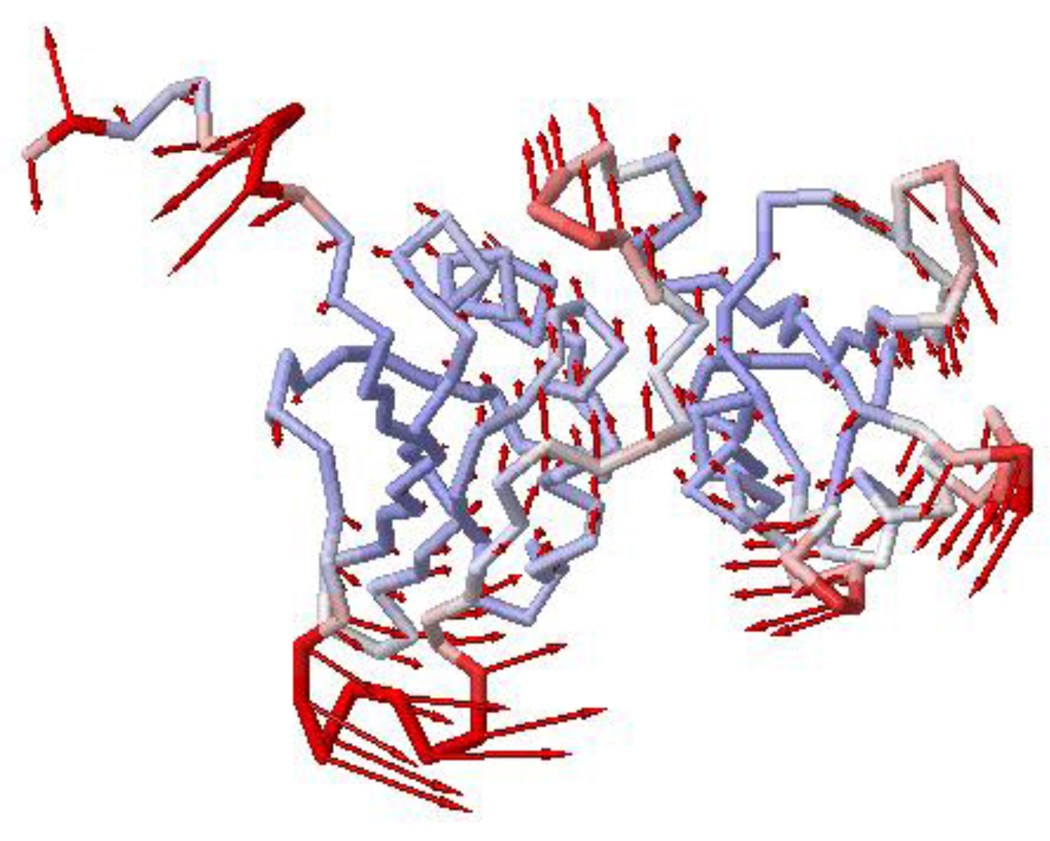
Polypyrimidine tract binding protein (PTB) participates in a variety of functions in eukaryotic cells, including alternative splicing, mRNA stabilization, and internal ribosomal entry site-mediated translation initiation. Its mechanism of RNA recognition is determined in part by the novel geometry of its two C-terminal RNA recognition motifs (RRM3 and RRM4), which interact with each other to form a stable complex (PTB1:34). This complex itself is unusual among RRMs, suggesting that it performs a specific function for the protein. In order to understand the advantage it provides to PTB, the fundamental properties of PTB1:34 are examined here as a comparative study of the complex and its two constituent RRMs. Both RRM3 and RRM4 adopt folded structures that NMR data show to be similar to their structure in PRB1:34. The RNA binding properties of the domains differ dramatically. The affinity of each separate RRM for polypyrimidine tracts is far weaker than that of PTB1:34, and simply mixing the two RRMs does not create an equivalent binding platform. (15)N NMR relaxation experiments show that PTB1:34 has slow, microsecond motions throughout both RRMs including the interdomain linker. This is in contrast to the individual domains, RRM3 and RRM4, where only a few backbone amides are flexible on this time scale. The slow backbone dynamics of PTB1:34, induced by packing of RRM3 and RRM4, could be essential for high-affinity binding to a flexible polypyrimidine tract RNA and also provide entropic compensation for its own formation.


Figures

Figure 1
Figure 1. Features of a canonical RRM
A typical RRM has an αβ-sandwich fold (a) that consists of a four stranded antiparallel β-sheet packed against two α-helices. Two RNP consensus sequences are important for protein function and reside in the center of the β-sheet, with the hexamer RNP2 sequence on β1, and the octamer RNP1 on β3. All four RRMs of PTB have RNP sequences which differ significantly from the RRM consensus (b). Important differences include a lack of aromatic side chains in both RNPs, which generally stack with RNA bases upon binding, as well as a lack of a glycine residue at the beginning of RNP1, thought to be important for mobility of the adjacent loop, a feature important for binding in other RRMs.
Figure 2
Figure 2. Justaposition of RRMs in PTB1:34 increased RNA binding affinity
Electrophoretic mobility shift assays were used to compare the relative binding affinities of the GABAA γ2 pre-mRNA intron (a) to the PTB1:34 protein constructs. PTB1:34 binds at the lowest protein concentration tested, 10 nM, while RRM4 does not bind at all, even at the highest concentration tested, 10 µM (b). A similar comparison in (c) shows that RRM3 does bind to this RNA, but with around 50-fold lower affinity than PTB1:34, as the first significant band shift does not occur at protein concentrations less than 500 nM. Mixing RRM3 and RRM4 does not rescue the RNA binding (d), since an equimolar mixture of the two domains binds with affinity similar to that of RRM3 alone. All EMSAs were run at 4° C, and included a lane with RNA only as a negative control, and a lane with 800 nM full-length PTB, which is known to bind to this RNA with high affinity (KD ~ 1 nM for the first binding event in these solution conditions), as a positive control.
Figure 3
Figure 3. Electrostatic potentials of PTB1:34 and the individual domains may contribute to their functional differences
Electrostatic potential mapped onto the solvent accessible surface area of PTB1:34 (a), RRM3 (b), and RRM4 (c), with positive patches shown in blue, and negative patches in red, shows that the interaction between RRM3 and RRM4 organizes the charge distribution of the protein, and may be important to protein function.
Figure 4
Figure 4. Changes in chemical shifts between the individual and interacting domains indicate only minor changes when the domains are separated
The change in chemical shift, Δδ, in terms of proton ppm, show that the majority of differences are concentrated at the RRM3/RRM4 interface. Δδ is shown as bars with the protein secondary structure indicated by bars (α-helix) and arrows (β-strand) along the top of the plot. For visual clarity, these changes are mapped onto the structure of PTB1:34 (inset), where white shows the areas of the protein were no data were available, grey indicates no significant Δδ (< 0.25 ppm), blue indicates Δδ between 0.25 and 0.50 ppm, violet, Δδ between 0.50 and 0.75 ppm, purple between 0.75 and 1.00 ppm, and magenta shows the most significant Δδ of greater than 1.00 ppm. Many residues in the interdomain linker are expected to have significant chemical shift changes due to altered environment but could not be calculated since the linker region was largely unassignable for the individual domains.
Figure 5
Figure 5. Fast and slow dynamics of PTB1:34
Order parameters (S2, top panel) reflecting ps-ns motions and Rex terms (bottom panel) indicating slow (µs-ms) motions are similar for PTB1:34 at 300 µM (green triangles) and 1 mM (blue diamonds) at 700 MHz, and in a global fit of 1 mM PTB1:34 relaxation data at 500 and 600 MHz (red squares). Modelfree fits to T1, T2, and 1H/15N NOE data do show some variation for order parameters and Rex terms for the three parameter sets, but the trends are consistent. The two data sets at 700 MHz differ primarily in the properties of the residues flanking the loops, but most notably in the global tumbling times with τM= 7.2 ± 0.06 ns at 300 µM and τM = 9.2 ± 0.10 at 1mM. While protein self-association is likely to contribute to chemical exchange, we propose that it is not responsible for the extensive Rex terms that pervade PTB1:34 in all conditions here. Data are plotted against residue number (PDB ID: 2EVZ) with secondary structure elements indicated at the top.
Figure 6
Figure 6. ModelFree analysis suggests that slow protein motions throughout PTB1:34 occur as a consequence of the RRM3/RRM4 interaction
Lipari-Szabo order parameters, S2, are given in the top panel for PTB1:34 (○), and the individual RRMs (■). Both RRM3 and RRM4 are much more rigid alone than in the context of PTB1:34, as evident upon comparison of the exchange contribution to transverse relaxation (Rex) for PTB1:34 (bottom) and RRM3/RRM4 (middle). While PTB1:34 has uniformly dispersed Rex terms of significant magnitude throughout the protein body, only a few residues in RRM3 and RRM4 require similar Rex terms. This analysis shows that the differences in dynamic properties of the protein constructs are slow (µs-ms) motions that arise as a consequence of the RRM3/RRM4 interaction. Data were collected in 20 mM potassium phosphate buffer, pH 6.8, and 100 mM KCl at 500 MHz for 1 mM RRM4 and 700 MHz for 300 µM RRM3. Data for 1 mM PTB1:34 were collected at 500, 600, and 700 MHz; R2 plots for PTB1:34 are shown in Figure S4.
Figure 7
Figure 7. Relaxation interference experiments confirm the presence of slow motions throughout the body of PTB1:34
Transverse relaxation rates from standard experiments, R2 (○), are compared to the exchange-free transverse relaxation rate, κηxy (■), in the top panel, plotted against residue number. The difference between the two rates, Rex, shown in the bottom panel, confirms the results obtained from ModelFree analysis of the relaxation data, and verify that slow motions persist throughout the body of PTB1:34. Data were collected at 700 MHz for 1 mM PTB1:34.
Figure 8
Figure 8. Residues which undergo microsecond exchange are identified by ΔR experiments, and are in qualitative agreement with the ModelFree results
A schematic representation of ΔR is shown in (a) with dispersion curves for a residue with microsecond exchange (blue curve) and a residue with no microsecond exchange (grey curve). Importantly, this figure shows the propensity of the method to underestimate the exchange contribution to R2 because the R rates at the spin lock field strength of 0 Hz cannot be extrapolated for non-two-state systems. ΔR results are shown in (b), plotted against residue number, and mapped onto the 3-dimensional structure in (c) (PDB ID: 2EVZ). These results indicate that residues throughout PTB1:34 are in microsecond exchange, and substantiate the Rex terms obtained from ModelFree.
Figure 9
Figure 9. The extensive slow motions throughout PTB1:34 are distinct from motions of RRM3 or RRM4 alone
Slow motions mapped onto the three dimensional structures of PTB1:34 (a), RRM3 (b) and RRM4 (c) (PDB ID: 2EVZ) show striking differences in dynamic properties of the constructs. Grey areas depict residues where no data are available, either because the residue could not be assigned or could not be fit by ModelFree; black regions show residues were data are available, but no Rex term was needed to fit the data. Colored regions indicate Rex terms increasing in magnitude from blue (0–2 Hz), violet (2–5 Hz) to red (> 5 Hz). While PTB1:34 has significant Rex terms throughout the protein, RRM3 and RRM4 are much more rigid on this timescale, giving rise to only a handful of Rex terms indicative of slow motions.
Figure 10
Figure 10. Normal mode calculation of the fluctuations in PTB1:34
This is mode 6 of the 20 modes calculated for structure PDB ID: 2EVZ. Red colors correspond to large fluctuations and blue colors to small fluctuations; the vectors indicate the direction of motion and their length corresponds to the amplitude of motion. RRM3 is on the left.

Similar articles

Cited by

References

    1. Boehr DD, McElheny D, Dyson HJ, Wright PE. The dynamic energy landscape of dihydrofolate reductase catalysis. Science. 2006;313:1638–1642. - PubMed
    1. Kempf JG, Jung J, Ragain C, Sampson NS, Loria JP. Dynamic requirements for a functional protein hinge. J. Mol. Biol. 2007;368:131–149. - PMC - PubMed
    1. Eisenmesser EZ, et al. Intrinsic dynamics of an enzyme underlies catalysis. Nature. 2005;438:117–121. - PubMed
    1. Labeikovsky W, Eisenmesser EZ, Bosco DA, Kern D. Structure and dynamics of pin1 durin catalysis by NMR. J. Mol. Biol. 2007;367:1370–1381. - PMC - PubMed
    1. Bracken C, Carr PA, Cavanagh J, Palmer AG. Temperature dependence of intramolecular dynamics of the basic leucine zipper of GCN4: Implications for the entropy of association with DNA. J. Mol. Biol. 1999;285:2133–2146. - PubMed

Publication types

LinkOut - more resources