

Gamma delta T cell receptors confer autonomous responsiveness to the insulin-peptide B:9-23
- PMID: 20080388
- PMCID: PMC2860027
- DOI: 10.1016/j.jaut.2009.12.008
Gamma delta T cell receptors confer autonomous responsiveness to the insulin-peptide B:9-23
Abstract
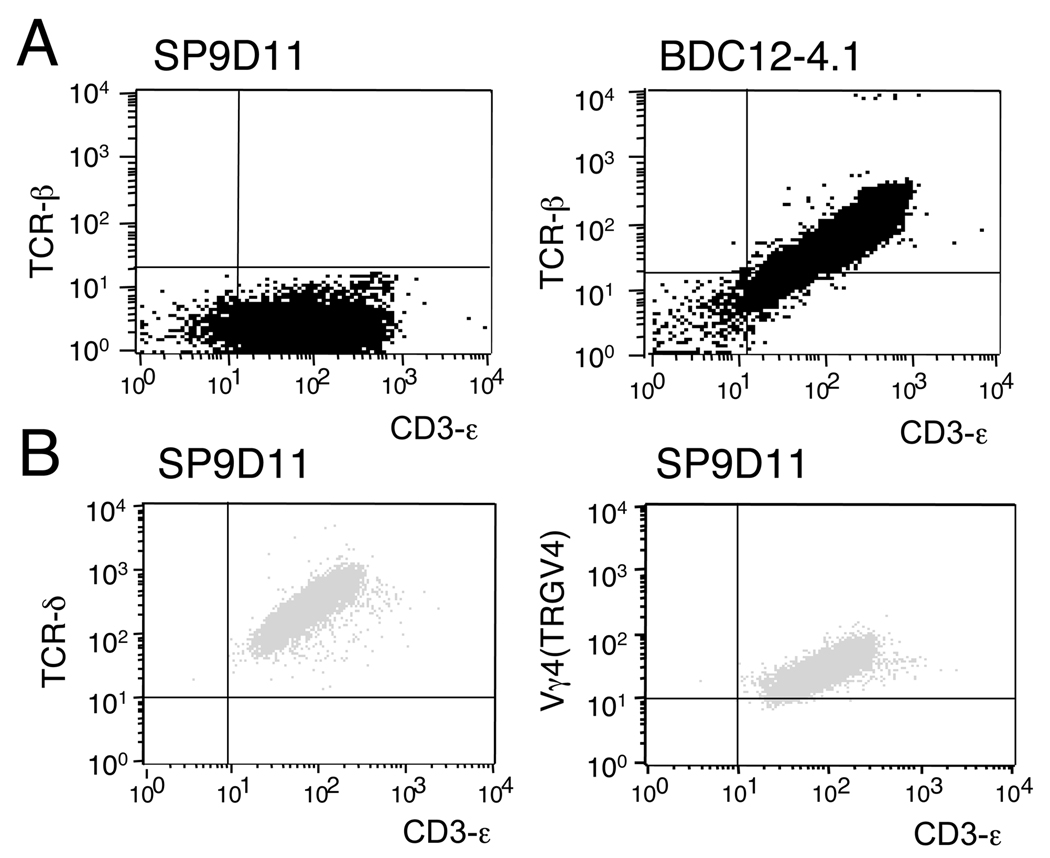
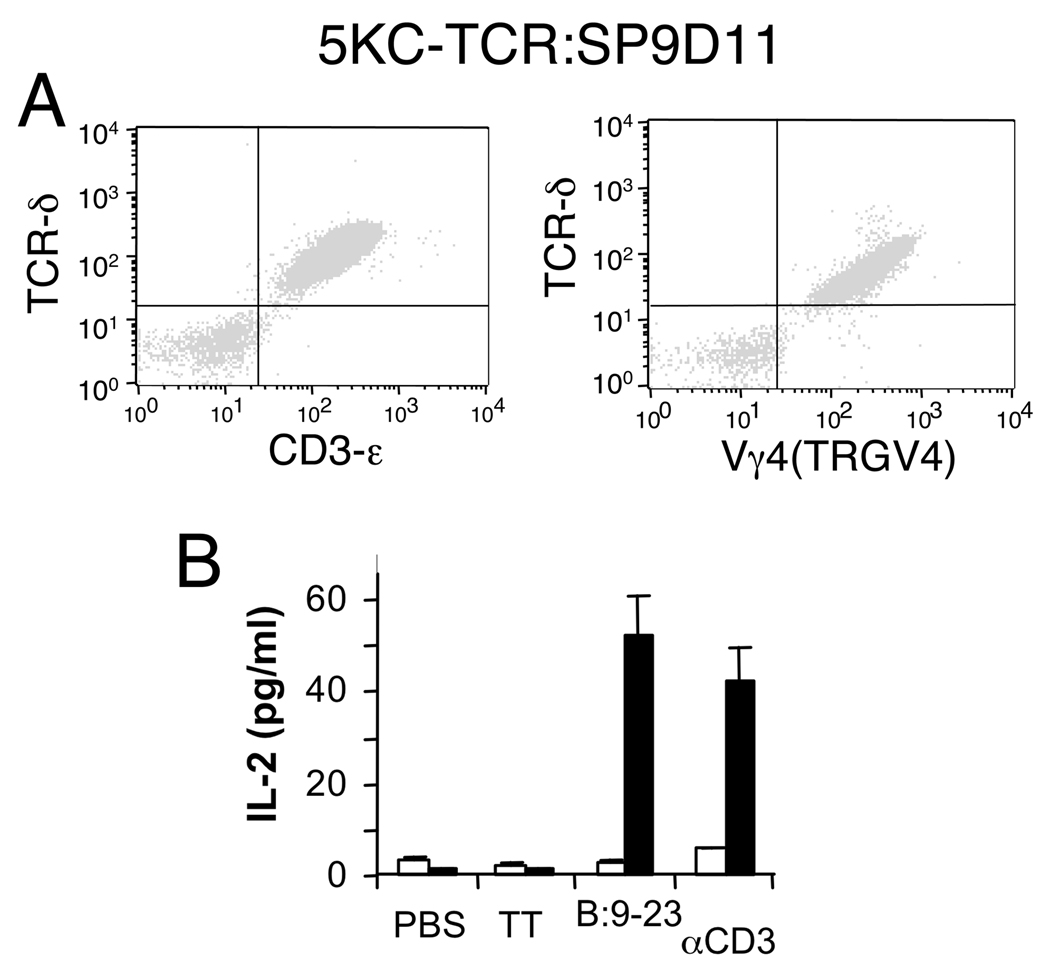
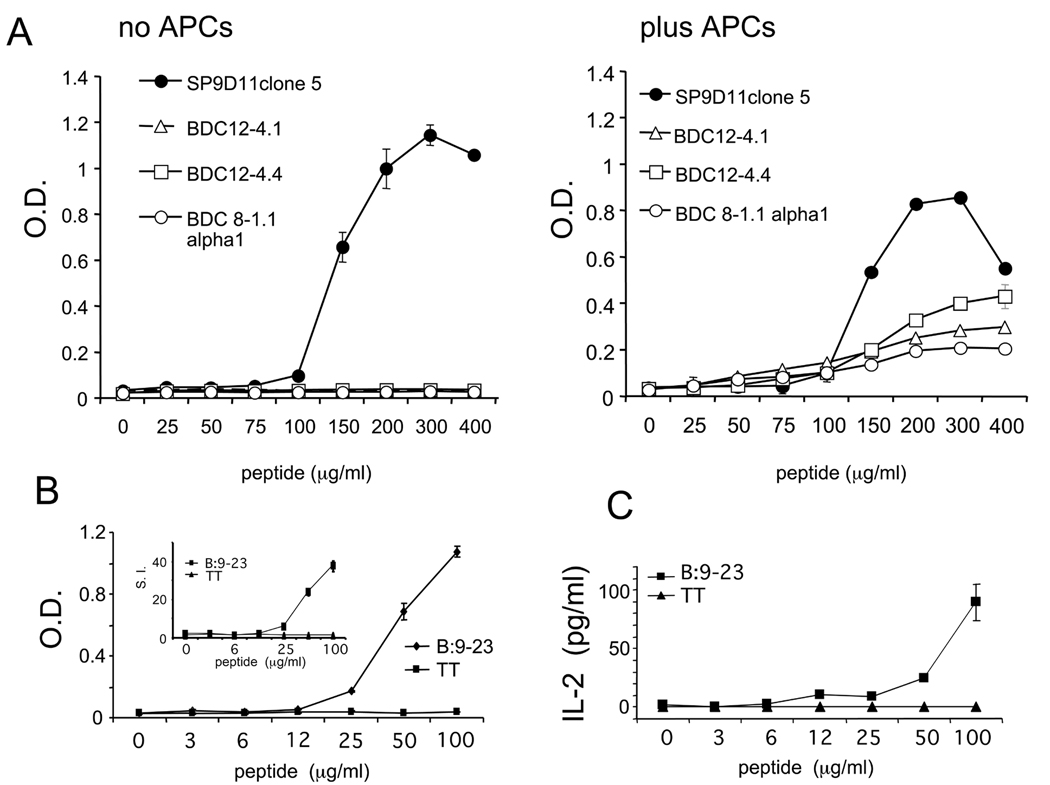
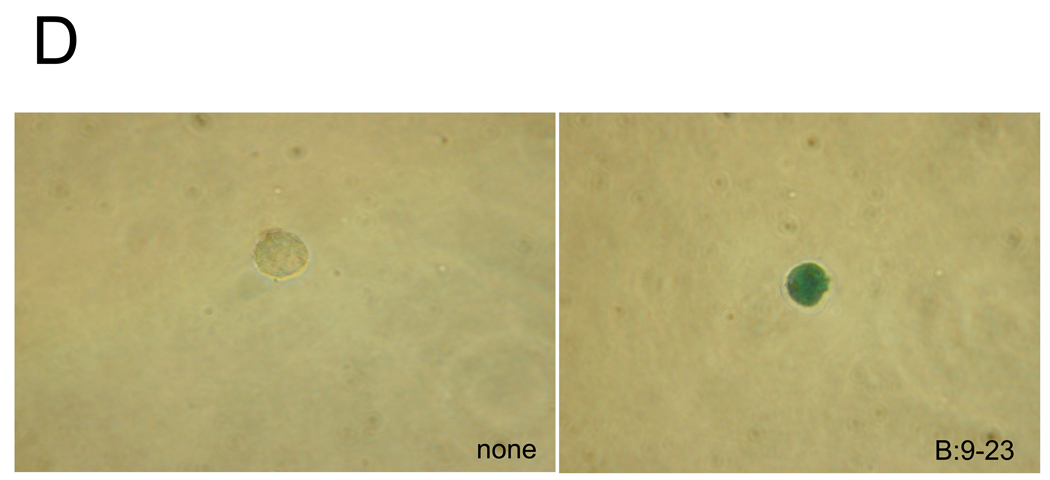
The range and physical qualities of molecules that act as ligands for the gammadelta T cell receptors (TCRs) remain uncertain. Processed insulin is recognized by alphabeta T cells, which mediate diabetes in non-obese diabetic (NOD) mice. Here, we present evidence that gammadelta T cells in these mice recognize processed insulin as well. Hybridomas generated from NOD spleen and pancreatic lymph nodes included clones expressing gammadelta TCRs that responded specifically to purified islets of Langerhans and to an insulin peptide, but not to intact insulin. The gammadelta TCRs associated with this type of response are diverse, but a cloned gammadelta TCR was sufficient to transfer the response. The response to the insulin peptide was autonomous as demonstrated by stimulating single responder cells in isolation. This study reveals a novel specificity for gammadelta TCRs, and raises the possibility that gammadelta T cells become involved in islet-specific autoimmunity.
Figures


Similar articles
-
γδ T cells recognize the insulin B:9-23 peptide antigen when it is dimerized through thiol oxidation.Mol Immunol. 2014 Aug;60(2):116-28. doi: 10.1016/j.molimm.2014.04.007. Epub 2014 May 20. Mol Immunol. 2014. PMID: 24853397 Free PMC article.
-
Priming and effector dependence on insulin B:9-23 peptide in NOD islet autoimmunity.J Clin Invest. 2007 Jul;117(7):1835-43. doi: 10.1172/JCI31368. J Clin Invest. 2007. PMID: 17607359 Free PMC article.
-
CD4+CD25+ regulatory T cells generated in response to insulin B:9-23 peptide prevent adoptive transfer of diabetes by diabetogenic T cells.J Autoimmun. 2003 Nov;21(3):221-37. doi: 10.1016/s0896-8411(03)00114-8. J Autoimmun. 2003. PMID: 14599847
-
Structure of gammadelta T cell receptors and their recognition of non-peptide antigens.Mol Immunol. 2002 May;38(14):1051-61. doi: 10.1016/s0161-5890(02)00034-2. Mol Immunol. 2002. PMID: 11955597 Review.
-
The role of islet antigen presenting cells and the presentation of insulin in the initiation of autoimmune diabetes in the NOD mouse.Immunol Rev. 2016 Jul;272(1):183-201. doi: 10.1111/imr.12430. Immunol Rev. 2016. PMID: 27319351 Free PMC article. Review.
Cited by
-
A Special Connection between γδ T Cells and Natural Antibodies?Arch Immunol Ther Exp (Warsz). 2016 Dec;64(6):455-462. doi: 10.1007/s00005-016-0403-0. Epub 2016 May 27. Arch Immunol Ther Exp (Warsz). 2016. PMID: 27235134 Free PMC article. Review.
-
Double negative (CD3+ 4- 8-) TCR alphabeta splenic cells from young NOD mice provide long-lasting protection against type 1 diabetes.PLoS One. 2010 Jul 2;5(7):e11427. doi: 10.1371/journal.pone.0011427. PLoS One. 2010. PMID: 20625402 Free PMC article.
-
T-cell receptor retrogenic mice: a rapid, flexible alternative to T-cell receptor transgenic mice.Immunology. 2012 Jul;136(3):265-72. doi: 10.1111/j.1365-2567.2012.03574.x. Immunology. 2012. PMID: 22348644 Free PMC article. Review.
-
αβ versus γδ fate choice: counting the T-cell lineages at the branch point.Immunol Rev. 2010 Nov;238(1):169-81. doi: 10.1111/j.1600-065X.2010.00947.x. Immunol Rev. 2010. PMID: 20969592 Free PMC article. Review.
-
Prevention or early cure of type 1 diabetes by intranasal administration of gliadin in NOD mice.PLoS One. 2014 Apr 11;9(4):e94530. doi: 10.1371/journal.pone.0094530. eCollection 2014. PLoS One. 2014. PMID: 24728138 Free PMC article.
References
-
- Daniel D, Gill RG, Schloot N, Wegmann D. Epitope specificity, cytokine production profile and diabetogenic activity of insulin-specific T cell clonesisolated from NOD mice. Eur. J. Immunol. 1995;25:1056–1062. - PubMed
-
- Jasinski JM, Yu L, Nakayama M, Li MM, Lipes MA, Eisenbarth GS, Liu E. Transgenic insulin (B:9–23) T-cell receptor mice develop autoimmune diabetes dependent upon RAG genotype, H-2g7 homozygosity, and insulin 2 gene knockout. Diabetes. 2006;55:1978–1984. - PubMed
-
- Wong FS, Karttunen J, Dumont C, Wen L, Visintin I, Pilip IM, Shastri N, Pamer EG, Janeway CAJ. Identification of an MHC class I-restricted autoantigen in type 1 diabetes by screening an organ-specific cDNA library. Nat. Med. 1999;5:1026–1031. - PubMed
MeSH terms
Substances
Grants and funding
LinkOut - more resources
Full Text Sources
Other Literature Sources
Medical
